Disney World Early August Wait Time Comparisons

Entry posted by Webmaster in Data Analysis
2,252 views
How has the start of August in 2023 compared to previous years at each Walt Disney World theme park? Let's take a look at the data so far to find out!
Disney's Hollywood Studios
At DHS, wait times are down 7% compared to last year, but are up 12% compared to the same period in 2019.
2019: 12%
2022: -7%
.png.c50d0d5e4bdac44f9136e8fb96269dfa.png)
EPCOT
At EPCOT, wait times are very close to the same period last year, only down 2%. Wait times are up 9% compared to before the pandemic.
2019: 9%
2022: -2%
.png.e83b78f9e3b40038d33fb9fe3727aef4.png)
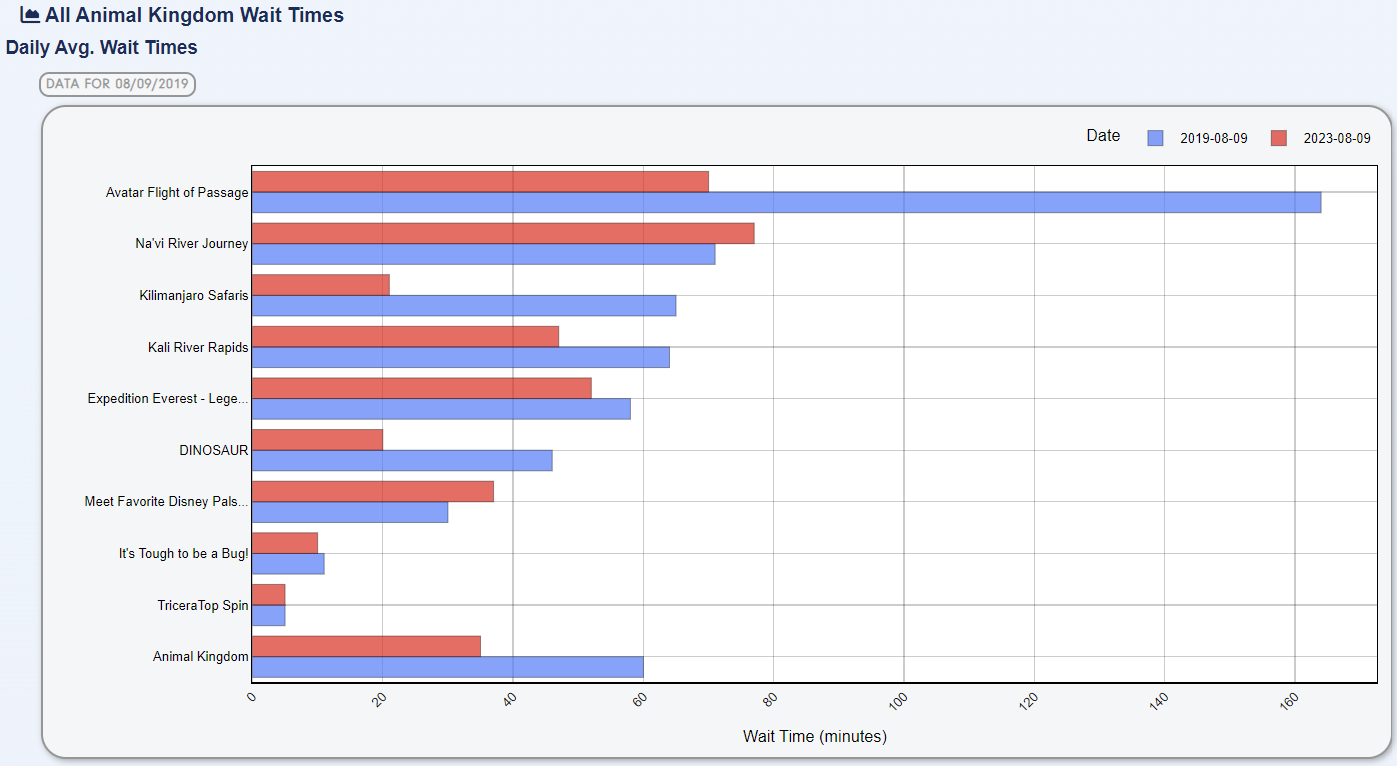
Disney's Animal Kingdom
The biggest difference to past years is at Animal Kingdom. Wait times are down over 20% compared to last year and 35% compared to before the pandemic!
2019: -35%
2022: -21%
.png.b4fd539a7ed041be635b125804d5cd75.png)
What is driving some of the differences at Animal Kingdom? Almost a 100 minute difference in the Avatar Flight of Passage wait time compared to 2019! Kilimanjaro Safaris are also well down at 40 minutes.
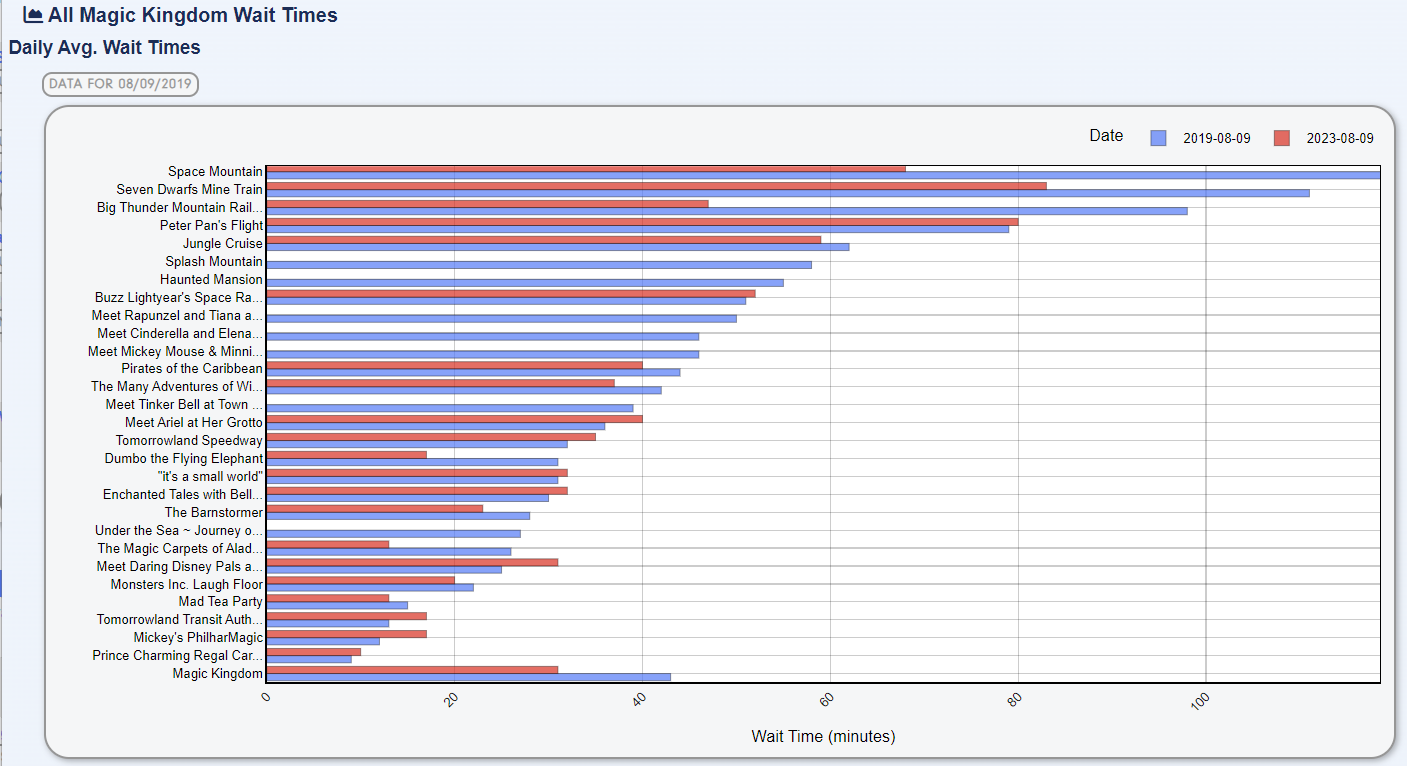
The Magic Kingdom
Magic Kingdom wait times have also been way down to start August compared to last year and 2019. A big difference this year to last is the number of attractions operating.
2019: -15%
2022: -22%
.png.8980007e0b4612dbdd439c6220f14c5d.png)
A big difference compared to 2019 is much lower wait times for the park's roller coasters this year.
-
 1
1


3 Comments
Recommended Comments
Create an account or sign in to comment
You need to be a member in order to leave a comment
Create an account
Sign up for a new account in our community. It's easy!
Register a new accountSign in
Already have an account? Sign in here.
Sign In Now