Disney World Week of 7/16/23 Recap

Entry posted by Webmaster in Weekly Recap
581 views
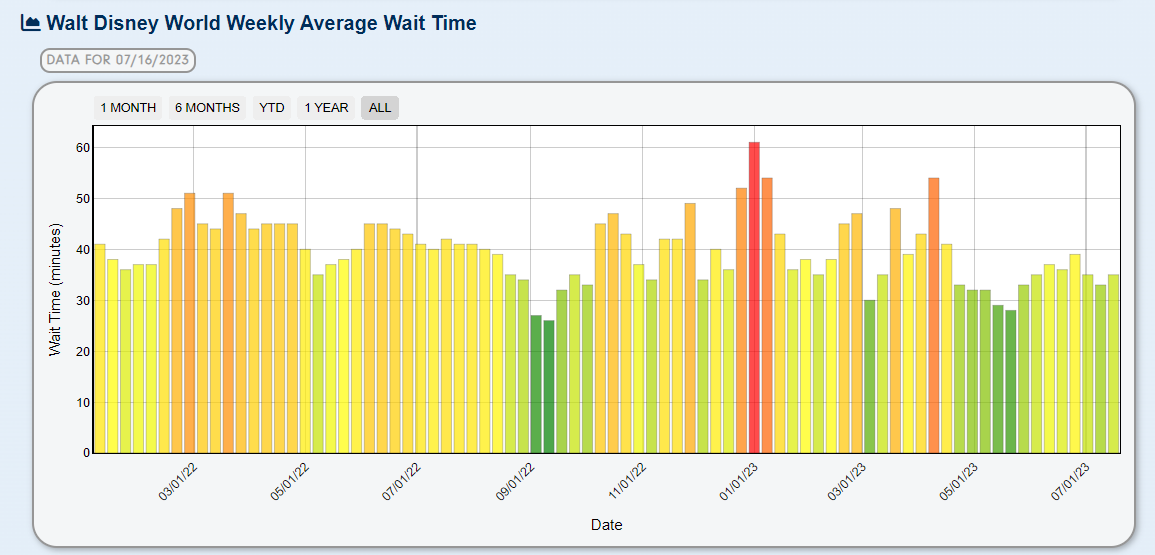
This week (7/10 to 7/16/2023), wait times across Walt Disney World were up 2 minutes over last week to 35 minutes. Out of the past 80 weeks, this week would rank #58. The same week last year ranks #28 with an average wait time of 42 minutes.
The attraction with the longest wait time by average was Avatar Flight of Passage

These were the hardest Lightning Lane slots for each park:
Animal Kingdom

EPCOT

Hollywood Studios

Magic Kingdom


0 Comments
Recommended Comments
There are no comments to display.
Create an account or sign in to comment
You need to be a member in order to leave a comment
Create an account
Sign up for a new account in our community. It's easy!
Register a new accountSign in
Already have an account? Sign in here.
Sign In Now