Disney Parks August 2023 Wait Time Recap
August has quickly come and gone, and now we enter the fall season at the Disney theme parks, with Halloween events, and, typically, lower wait times with kids back in school. How did August wait times in 2023 compare to previous years? Let's take a look.
Disney's Animal Kingdom
At DAK, August wait times this year were down compared to last year and before the pandemic, but up over 2021. The Flight of Passage wait time being lower is a huge factor in this drop.
-
August 2023 vs:
- Average Wait: Difference of -8.5 min / -22.2%
- August 2019: Difference of -12.6 min / -31.2%
- August 2021: Difference of 9.1 min / 42.8%
- August 2022: Difference of -4.6 min / -13.4%
.png.c81c2402d0a5a44f308c8c99ce593b34.png)
EPCOT
At EPCOT, August wait times were higher, on average, than each August going back to 2019. Wait times were down about 4% from the yearly average wait time.
-
August 2023 vs:
- Average Wait: Difference of -4.1 min / -13.4%
- August 2019: Difference of 1.7 min / 7.2%
- August 2021: Difference of 10.8 min / 67.6%
- August 2022: Difference of 0.2 min / 0.8%
-

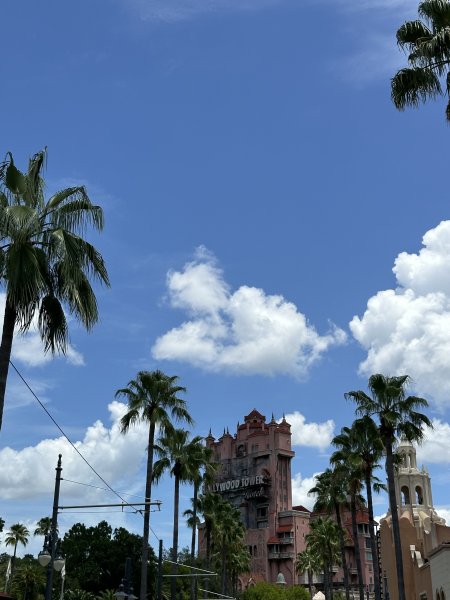
Disney's Hollywood Studios
At DHS, August wait times were down nearly 5% compared to last year, but were up over 2019 and 2021. August was almost 16% below the yearly average Hollywood Studios wait time.
-
August 2023 vs:
- Average Wait: Difference of -7.1 min / -15.8%
- August 2019: Difference of 4.5 min / 13.6%
- August 2021: Difference of 9.9 min / 33.6%
- August 2022: Difference of -1.8 min / -4.6%
-

The Magic Kingdom
At the Magic Kingdom, August wait times were down compared 2019 and 2022, but up over 2021. The average wait time in August was down nearly 20% compared to the yearly average, indicating wait times were reasonable.
-
August 2023 vs:
- Average Wait: Difference of -5.9 min / -19.8%
- August 2019: Difference of -6.1 min / -21.4%
- August 2021: Difference of 1.2 min / 5.6%
-
August 2022: Difference of -3.7 min / -14.4%

Disney California Adventure
At DCA, August wait times were down over 16% compared to last year, but up over 30% over 2021. Wait times were also well below the yearly average, down 24%.
- August 2023 vs:
Disneyland
At Disneyland, August wait times were down almost 14% compared to last year, but were up over 20% compared to before the pandemic. Wait times, on average, were down 5 minutes compared to the yearly average.
- August 2023 vs:
Disneyland Paris
At DLP, August wait times were down 18% compared to last year and down 7% compared to the yearly average.
- Average Wait: Difference of -1.6 min / -7.0%
- August 2019: Difference of 0%
- August 2021: Difference of 0.9 min / 4.6%
-
August 2022: Difference of -4.3 min / -18.2%

Tokyo Disneyland
At TDR, August wait times were slightly higher than August of last year, and up nearly 23% over the yearly average.
- August 2023 vs:
Tokyo DisneySea
At DisneySea, August wait times were up over 8% compared to last August, and up 22% over the yearly average. More capacity at the Tokyo parks has led to these increases.
 THRILL DATA Community
.png.917a3d7d9df8ba5c67c2ad936c7057ec.png)
.png.006d40d9502232947dc6b94b3222898a.png)
.png.75a0fec565ce2fb5f5321e0dd13d22b4.png)
.thumb.png.215fcc11a2ebd19172beec7df3e8c507.png)
.thumb.png.3ba2daaa2afd9bd3c3112fb6c3c0d71f.png)
.thumb.png.86c784a0be49593a5ff50235eb06b696.png)
.thumb.png.78547a300541a53d3f196a17bf557141.png)
.thumb.png.f999a8894569f6d4d7fb8634c324dac6.png)


0 Comments
Recommended Comments
There are no comments to display.
Create an account or sign in to comment
You need to be a member in order to leave a comment
Create an account
Sign up for a new account in our community. It's easy!
Register a new accountSign in
Already have an account? Sign in here.
Sign In Now