Cedar Point 2023 Season Recap

Entry posted by Webmaster in Data Analysis
2,892 views
In what seems like a flash, the 2023 season has come and gone at America's Roller Coast: Cedar Point. This season introduced the new The Boardwalk section, featuring the Wild Mouse roller coaster, which replaced Wicked Twister. However, most of the focus was turned to what was going to happen to Top Thrill Dragster. Mid-season, it was announced that Top Thrill 2 would modify/replace the existing TTD layout and transform it into a triple-launched coaster with a new vertical spike. Top Thrill 2 is sure to be popular in 2024.
For the 2023 season, weekends continued to be quite a bit busier than weekdays, with Saturday averaging over a 35 minute wait time. Fast Lane Plus provided the most value on Saturday and Sunday, but was also the most expensive then.

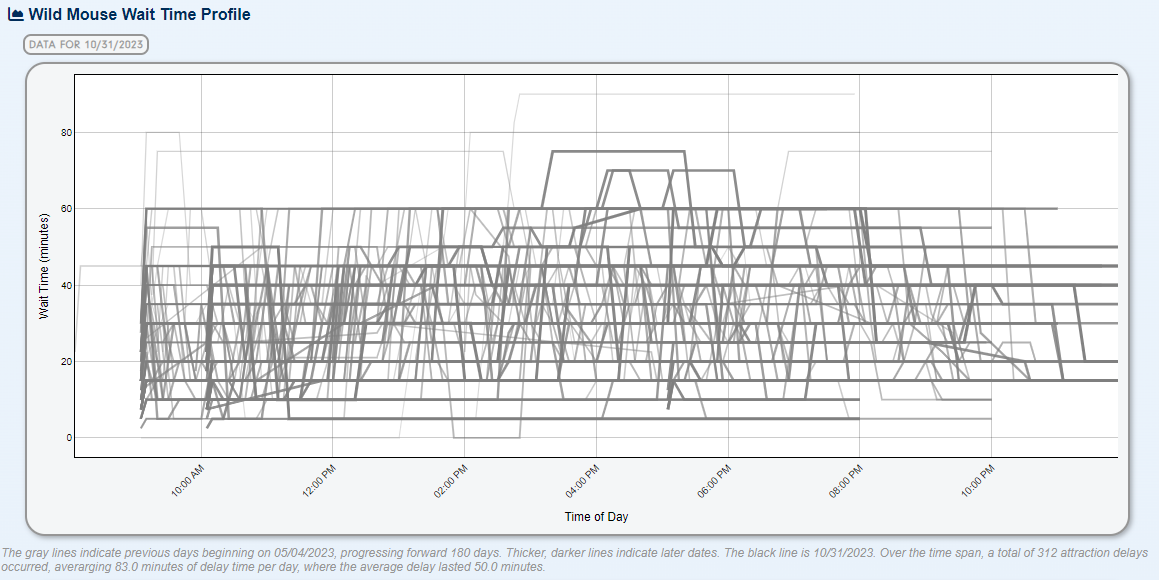
Wait times for the new Wild Mouse roller coaster remained mostly mild throughout the season, with an average wait time of 35 minutes, and a peak of 90 minutes.
Month Over Month Comparisons
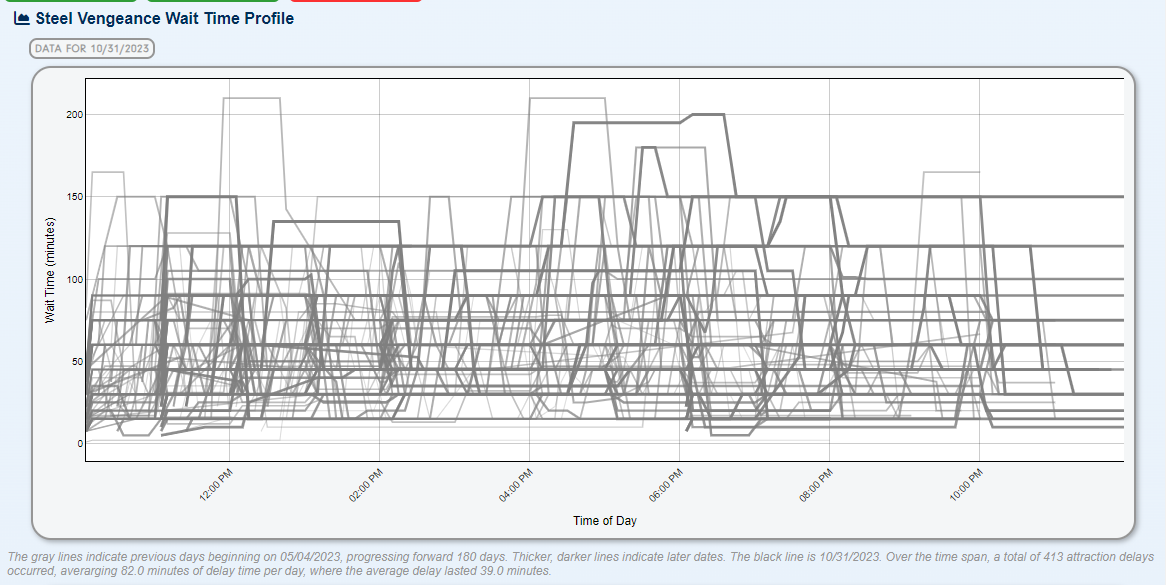
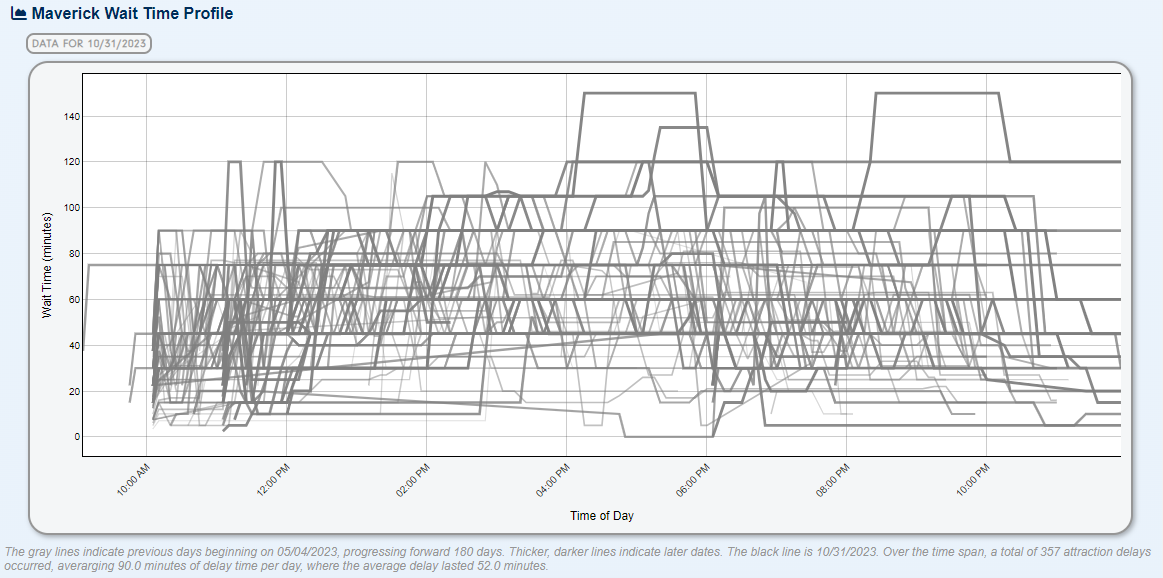
Most of the 2023 season at Cedar Point was remarkably consistent wait time wise, with May through August averaging around a 26 minute average wait time. September featured the lowest average wait times, while Halloweekends in October had, by far, the highest average wait times at 31 minutes. One oddity in the season was a very slow 4th of July week at the park. Typically, Steel Vengeance or Maverick held the top spot for the longest average wait time each month.


.png.4001ef1b441bc491827c64dd776a00f9.png)
Below, each month of the 2023 is compared to each other. Also, the monthly average wait times for each attraction are shown.
.png.2459b200025c5c2bcf19f039947299a9.png)
-
May 2023 vs:
- Average Wait: Difference of 1.6 min / 6.2%
- June 2023: Difference of 1.2 min / 4.6%
- July 2023: Difference of 3.2 min / 13.0%
- August 2023: Difference of 2.2 min / 8.4%
- September 2023: Difference of 4.8 min / 20.8%
- October 2023: Difference of -6.4 min / -18.6%

-
June 2023 vs:
- Average Wait: Difference of 1.4 min / 5.4%
- May 2023: Difference of -1.2 min / -4.4%
- July 2023: Difference of 2.1 min / 8.6%
- August 2023: Difference of 0.2 min / 0.6%
- September 2023: Difference of 5.0 min / 21.6%
- October 2023: Difference of -5.8 min / -17.0%

-
July 2023 vs:
- Average Wait: Difference of -0.5 min / -2.0%
- May 2023: Difference of -3.2 min / -11.4%
- June 2023: Difference of -2.1 min / -8.0%
- August 2023: Difference of -1.9 min / -7.2%
- September 2023: Difference of 1.1 min / 4.6%
- October 2023: Difference of -9.9 min / -29.0%

-
August 2023 vs:
- Average Wait: Difference of 0.1 min / 0.4%
- May 2023: Difference of -2.2 min / -7.8%
- June 2023: Difference of -0.2 min / -0.6%
- July 2023: Difference of 1.9 min / 7.8%
- September 2023: Difference of 3.0 min / 12.8%
- October 2023: Difference of -8.0 min / -23.6%

-
September 2023 vs:
- Average Wait: Difference of -3.5 min / -13.4%
- May 2023: Difference of -4.8 min / -17.2%
- June 2023: Difference of -5.0 min / -17.8%
- July 2023: Difference of -1.1 min / -4.4%
- August 2023: Difference of -3.0 min / -11.4%
- October 2023: Difference of -10.8 min / -32.0%

-
October 2023 vs:
- Average Wait: Difference of 7.7 min / 29.8%
- May 2023: Difference of 6.4 min / 22.8%
- June 2023: Difference of 5.8 min / 20.6%
- July 2023: Difference of 9.9 min / 41.0%
- August 2023: Difference of 8.0 min / 30.8%
- September 2023: Difference of 10.8 min / 47.0%

Year-to-Year Comparisons
Overall, Cedar Point wait times in 2023 were about 7% higher than 2022, but 11% lower than before the pandemic in 2019. While 2021 numbers are high, COVID related measures often led to more inflated numbers. Expect a big season in 2024 at Cedar Point with Top Thrill 2 opening.
.png.c2dffdf37a556c572ba653bd9a4a3992.png)
Blue: 2019, Red: 2021, Green: 2022, Purple: 2023
-
Cedar Point Date Range: 01/01/2019 to 12/31/2019 vs:
- Average Wait: Difference of 4.2 min / 16.2%
- Cedar Point Date Range: 01/01/2021 to 12/31/2021: Difference of -4.0 min / -11.8%
- Cedar Point Date Range: 01/01/2022 to 12/31/2022: Difference of 5.2 min / 20.8%
- Cedar Point Date Range: 01/01/2023 to 12/31/2023: Difference of 3.3 min / 12.4%
-
Cedar Point Date Range: 01/01/2021 to 12/31/2021 vs:
- Average Wait: Difference of 8.1 min / 31.6%
- Cedar Point Date Range: 01/01/2019 to 12/31/2019: Difference of 4.0 min / 13.2%
- Cedar Point Date Range: 01/01/2022 to 12/31/2022: Difference of 9.1 min / 36.8%
- Cedar Point Date Range: 01/01/2023 to 12/31/2023: Difference of 7.3 min / 27.4%
-
Cedar Point Date Range: 01/01/2022 to 12/31/2022 vs:
- Average Wait: Difference of -1.0 min / -3.8%
- Cedar Point Date Range: 01/01/2019 to 12/31/2019: Difference of -5.2 min / -17.2%
- Cedar Point Date Range: 01/01/2021 to 12/31/2021: Difference of -9.1 min / -27.0%
- Cedar Point Date Range: 01/01/2023 to 12/31/2023: Difference of -1.8 min / -6.8%
-
Cedar Point Date Range: 01/01/2023 to 12/31/2023 vs:
- Average Wait: Difference of 0.8 min / 3.2%
- Cedar Point Date Range: 01/01/2019 to 12/31/2019: Difference of -3.3 min / -11.0%
- Cedar Point Date Range: 01/01/2021 to 12/31/2021: Difference of -7.3 min / -21.4%
- Cedar Point Date Range: 01/01/2022 to 12/31/2022: Difference of 1.8 min / 7.4%
Month-to-Past Comparisons
The following graphs compare each month of the operating season going back to 2019.
.png.9658d410003e335979f9d3956fec25a1.png)
-
May 2019 vs:
- Average Wait: Difference of -4.2 min / -16.2%
- May 2021: Difference of -15.1 min / -41.0%
- May 2022: Difference of -6.0 min / -21.6%
- May 2023: Difference of -5.8 min / -21.2%
-
May 2021 vs:
- Average Wait: Difference of 10.9 min / 42.2%
- May 2019: Difference of 15.1 min / 69.6%
- May 2022: Difference of 9.1 min / 33.0%
- May 2023: Difference of 9.2 min / 33.8%
-
May 2022 vs:
- Average Wait: Difference of 1.8 min / 6.8%
- May 2019: Difference of 6.0 min / 27.6%
- May 2021: Difference of -9.1 min / -24.8%
- May 2023: Difference of 0.2 min / 0.6%
-
May 2023 vs:
- Average Wait: Difference of 1.6 min / 6.2%
- May 2019: Difference of 5.8 min / 26.8%
- May 2021: Difference of -9.2 min / -25.2%
- May 2022: Difference of -0.2 min / -0.6%
.png.a59de94a3845002a16f375fc17679816.png)
-
June 2019 vs:
- Average Wait: Difference of -2.1 min / -8.2%
- June 2021: Difference of -12.4 min / -34.4%
- June 2022: Difference of 1.2 min / 5.4%
- June 2023: Difference of -3.5 min / -12.8%
-
June 2021 vs:
- Average Wait: Difference of 10.3 min / 40.0%
- June 2019: Difference of 12.4 min / 52.6%
- June 2022: Difference of 13.7 min / 60.8%
- June 2023: Difference of 9.0 min / 33.0%
-
June 2022 vs:
- Average Wait: Difference of -3.3 min / -12.8%
- June 2019: Difference of -1.2 min / -5.0%
- June 2021: Difference of -13.7 min / -37.8%
- June 2023: Difference of -4.7 min / -17.2%
-
June 2023 vs:
- Average Wait: Difference of 1.4 min / 5.2%
- June 2019: Difference of 3.5 min / 14.8%
- June 2021: Difference of -9.0 min / -24.8%
- June 2022: Difference of 4.7 min / 20.8%
.png.c91c90726ce8541c0774031312e34437.png)
-
July 2019 vs:
- Average Wait: Difference of 2.1 min / 8.0%
- July 2021: Difference of -10.6 min / -27.6%
- July 2022: Difference of 3.3 min / 13.2%
- July 2023: Difference of 2.6 min / 10.2%
-
July 2021 vs:
- Average Wait: Difference of 12.7 min / 49.2%
- July 2019: Difference of 10.6 min / 38.0%
- July 2022: Difference of 13.9 min / 56.4%
- July 2023: Difference of 13.2 min / 52.2%
-
July 2022 vs:
- Average Wait: Difference of -1.2 min / -4.6%
- July 2019: Difference of -3.3 min / -11.8%
- July 2021: Difference of -13.9 min / -36.0%
- July 2023: Difference of -0.7 min / -2.6%
-
July 2023 vs:
- Average Wait: Difference of -0.5 min / -2.0%
- July 2019: Difference of -2.6 min / -9.2%
- July 2021: Difference of -13.2 min / -34.2%
- July 2022: Difference of 0.7 min / 2.8%
.png.694cc950ef2660d75fa371205718ecf8.png)
-
August 2019 vs:
- Average Wait: Difference of 8.8 min / 34.2%
- August 2021: Difference of 5.5 min / 19.0%
- August 2022: Difference of 11.0 min / 47.0%
- August 2023: Difference of 8.7 min / 33.6%
-
August 2021 vs:
- Average Wait: Difference of 3.3 min / 12.8%
- August 2019: Difference of -5.5 min / -16.0%
- August 2022: Difference of 5.5 min / 23.4%
- August 2023: Difference of 3.2 min / 12.2%
-
August 2022 vs:
- Average Wait: Difference of -2.2 min / -8.8%
- August 2019: Difference of -11.0 min / -32.0%
- August 2021: Difference of -5.5 min / -19.0%
- August 2023: Difference of -2.3 min / -9.0%
-
August 2023 vs:
- Average Wait: Difference of 0.1 min / 0.4%
- August 2019: Difference of -8.7 min / -25.2%
- August 2021: Difference of -3.2 min / -11.0%
- August 2022: Difference of 2.3 min / 10.0%
.png.a16d51ba5bfffcb525bf46414b1c3214.png)
-
September 2019 vs:
- Average Wait: Difference of 14.0 min / 54.2%
- September 2021: Difference of 12.2 min / 44.4%
- September 2022: Difference of 22.4 min / 129.0%
- September 2023: Difference of 17.5 min / 78.2%
-
September 2021 vs:
- Average Wait: Difference of 1.7 min / 6.8%
- September 2019: Difference of -12.2 min / -30.8%
- September 2022: Difference of 10.2 min / 58.4%
- September 2023: Difference of 5.2 min / 23.4%
-
September 2022 vs:
- Average Wait: Difference of -8.4 min / -32.6%
- September 2019: Difference of -22.4 min / -56.4%
- September 2021: Difference of -10.2 min / -37.0%
- September 2023: Difference of -4.9 min / -22.2%
-
September 2023 vs:
- Average Wait: Difference of -3.5 min / -13.6%
- September 2019: Difference of -17.5 min / -44.0%
- September 2021: Difference of -5.2 min / -19.0%
- September 2022: Difference of 4.9 min / 28.4%
.png.c36a01698e0745b52e552b0d5b582dec.png)
-
October 2019 vs:
- Average Wait: Difference of 23.9 min / 92.6%
- October 2021: Difference of 14.9 min / 42.4%
- October 2022: Difference of 14.2 min / 39.4%
- October 2023: Difference of 16.5 min / 49.4%
-
October 2021 vs:
- Average Wait: Difference of 9.3 min / 35.8%
- October 2019: Difference of -14.9 min / -29.8%
- October 2022: Difference of -0.7 min / -2.0%
- October 2023: Difference of 1.6 min / 4.8%
-
October 2022 vs:
- Average Wait: Difference of 10.0 min / 38.8%
- October 2019: Difference of -14.2 min / -28.4%
- October 2021: Difference of 0.7 min / 2.0%
- October 2023: Difference of 2.4 min / 7.0%
-
October 2023 vs:
- Average Wait: Difference of 7.7 min / 29.6%
- October 2019: Difference of -16.5 min / -33.0%
- October 2021: Difference of -1.6 min / -4.6%
- October 2022: Difference of -2.4 min / -6.6%
Ride Down Time
A hot topic this past season from Cedar Point visitors was how often major roller coasters went down for some technical issue. By our estimates, Maverick averaged 90 minutes of down time per day, Steel Vengeance 82 minutes, Millennium Force 62 minutes, Wild Mouse 83 minutes, GateKeeper 55 minutes, and Valravn 59 minutes. Now these are just estimates based on gaps in wait time data, which would include weather delays, but the numbers do support the fact that attractions were down quite a bit on a daily basis.


2 Comments
Recommended Comments
Create an account or sign in to comment
You need to be a member in order to leave a comment
Create an account
Sign up for a new account in our community. It's easy!
Register a new accountSign in
Already have an account? Sign in here.
Sign In Now