Disneyland June '24 Analysis

Entry posted by Webmaster in Data Analysis
2,953 views
June has come and gone across Disneyland Resort in 2024. What were wait times like, how did they compare to the past, how was Lightning Lane availability, and what were the lightest & busiest days to go? Lets take a look at the data to find out!
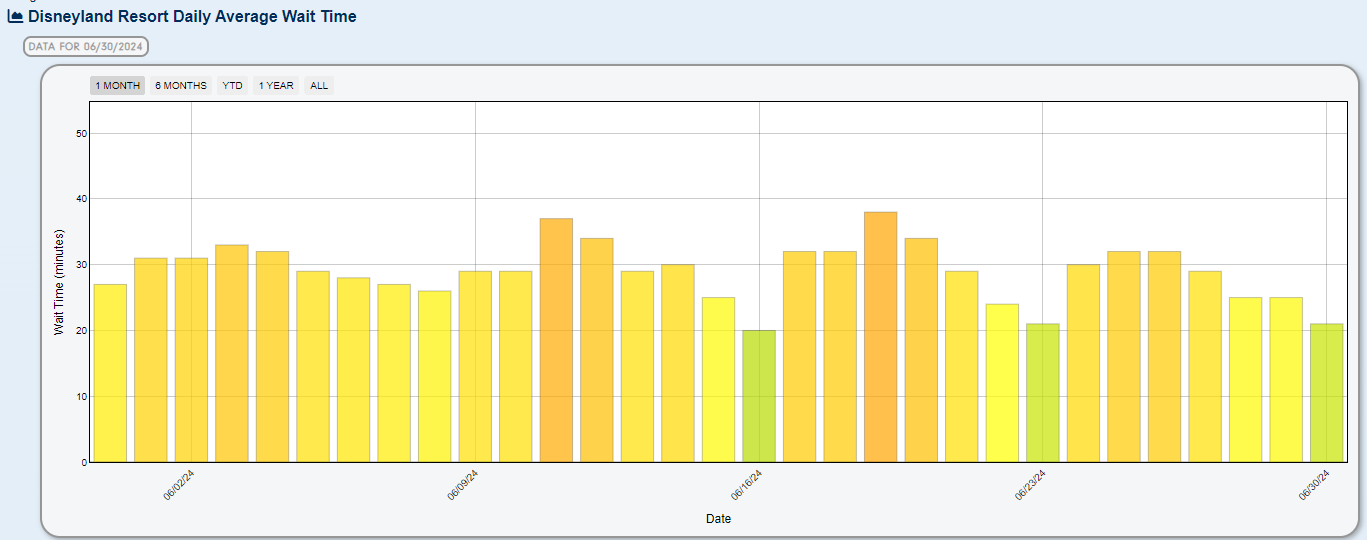
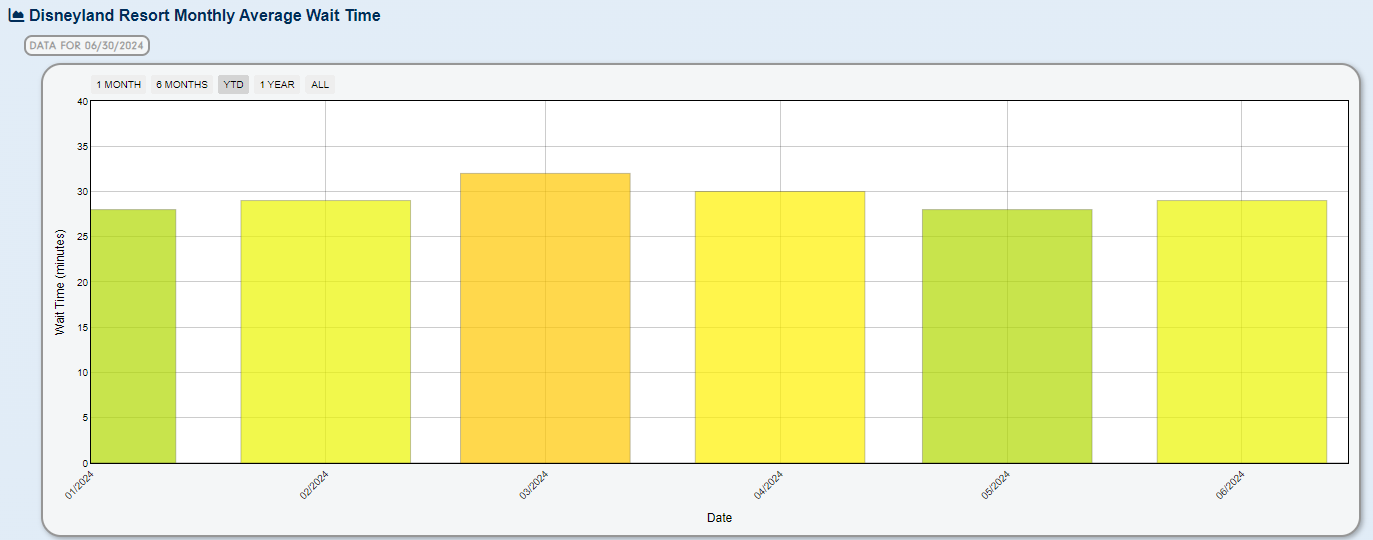
A resort-wide view of the daily average wait times shows (above) that typically Mondays and Tuesdays were the busiest days with the highest average wait times. The last three Sundays of the month were particularly light, thanks, in part, to the heat. The monthly average wait time, shown below, was up 1 minute over May of this year, and tied with February at 29 minutes.
At Disneyland, wait times were down 1 minute from June of 2023 during peak hours. As mentioned previously, hotter days tended to keep wait times down, as evidenced by June 23rd in the graph below.


When compared to 2019, before the pandemic, wait times this past June were up over 7 minutes on average. Compared to June of 2022, wait times were down 7 minutes. Overall, there was little difference between June '23 and '24 though.
-
June 2024 vs:
- Average Wait: Difference of -1.2 min / -4.6%
- June 2019: Difference of 7.5 min / 46.2%
- June 2022: Difference of -7.0 min / -22.4%
- June 2023: Difference of -0.1 min / -0.4%
.png.2fa9a4add571aa9b02089b7cd850f689.png)
When viewed as a calendar, it sticks out that weekends were typically had lower wait times than the weekdays. The highest wait times were typically seen Monday through Wednesday. The spread of wait times was quite high, with a few days reaching average wait times of 45 minutes at their peak while other only hit 20 minutes at peak.


Throughout June, Lightning Lane availability was quite good (Genie+ and Individual Lightning Lane) at Disneyland. The graph below shows the percentage of time at each time of the day that Lightning lane was available for a given attraction (green means it was likely available at a given time, red not likely). Most attractions maintained availability up to 3 PM, at which attractions like Indiana Jones, Space Mountain, and the Matterhorn began to reach capacity on some days. Did you know that these attractions often release more Lightning Lane availability at consistent times? We track those here!

At California Adventure, June wait times were also down 1 minute from last year. Like Disneyland, weekends tended to have shorter wait times than Monday through Wednesday.


Throughout June, Lightning Lane availability was quite good (Genie+ and Individual Lightning Lane) at DCA. The graph below shows the percentage of time at each time of the day that Lightning lane was available for a given attraction. Only Mission Breakout was reaching Lightning Lane capacity before the afternoon on some days.

More Disneyland Content to Explore

0 Comments
Recommended Comments
There are no comments to display.
Create an account or sign in to comment
You need to be a member in order to leave a comment
Create an account
Sign up for a new account in our community. It's easy!
Register a new accountSign in
Already have an account? Sign in here.
Sign In Now