Universal Orlando June '24 Analysis

Entry posted by Webmaster in Data Analysis
1,676 views
Summer arrived last month at Universal Orlando Resort with intense heat and the stormy season began. What were wait times like, how did they compare to the past, and what were the lightest & busiest days to go at Universal Orlando Resort? Lets take a look at the data to find out!
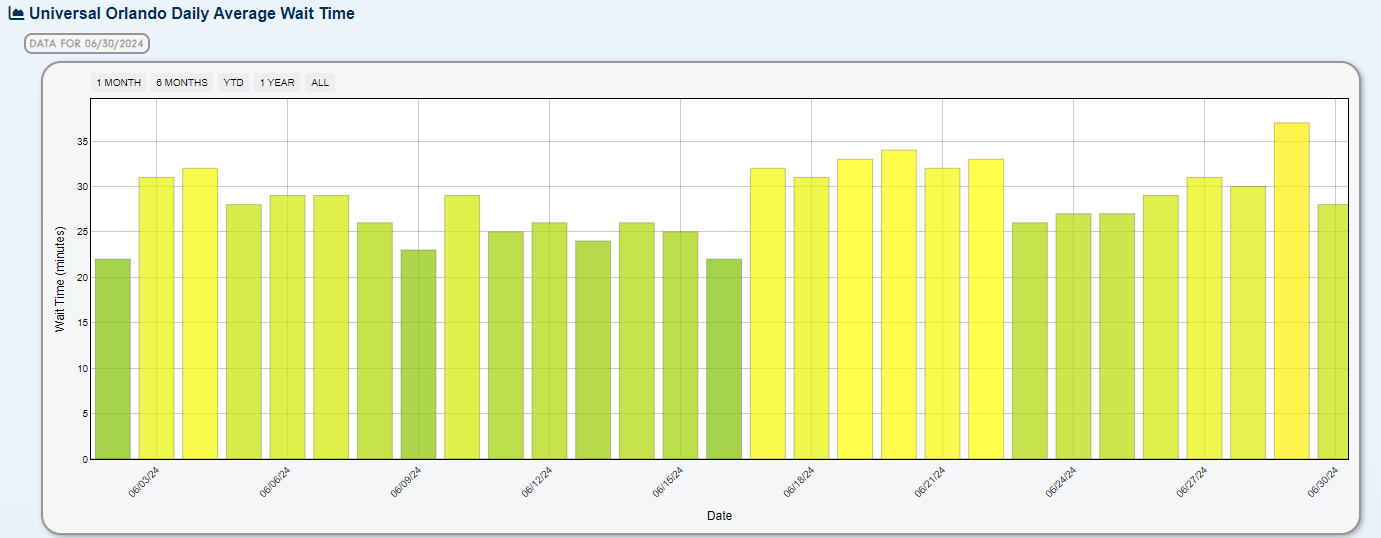
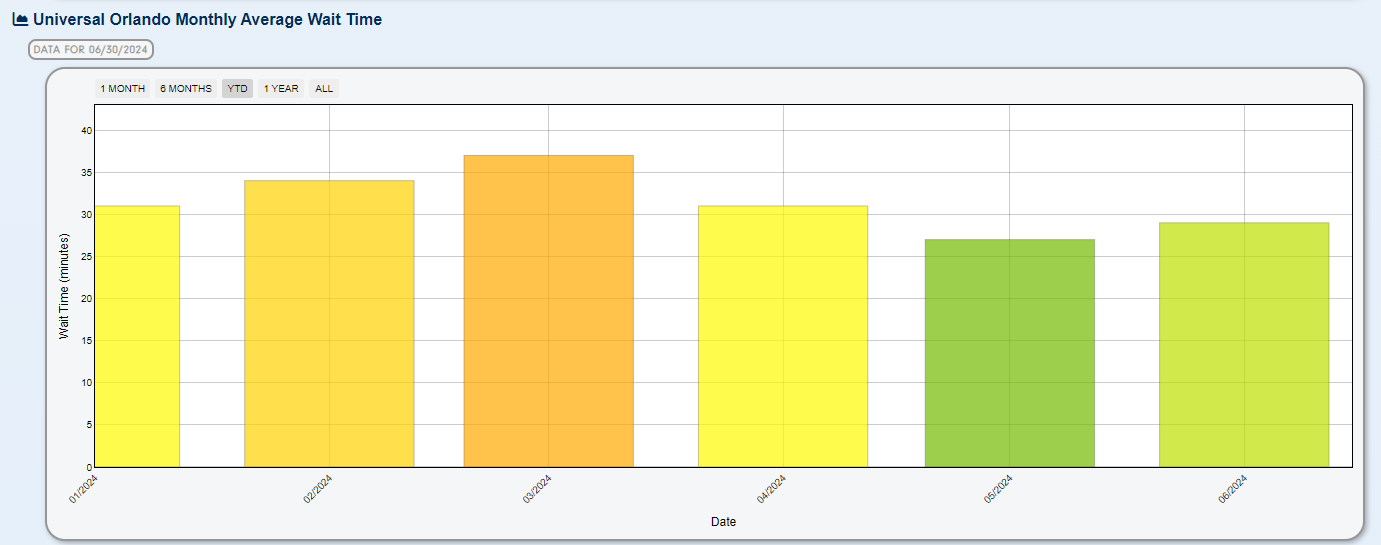
A resort-wide view of the daily average wait times shows a slight upward trend in wait times over the course of the month. Overall, wait times were up 2 minutes over May, but still the 2nd lowest, based on monthly average, for the year.
At IOA, wait times were down 2 minutes from June of 2023, during peak hours, but slightly up from pre-pandemic in 2019. On a per ride basis, it is noticeable that VelociCoaster wait times have gotten lower, but Hagrid has stayed pretty constant.


Typically, Mondays and Saturdays had the highest wait times with slower days on Tuesdays and Sundays.

Comparisons to past Junes:
-
June 2024 vs:
- Average Wait: Difference of -4.0 min / -13.2%
- June 2019: Difference of 1.7 min / 7.2%
- June 2021: Difference of -5.9 min / -19.4%
- June 2022: Difference of -7.6 min / -23.6%
- June 2023: Difference of -3.0 min / -11.0%
.png.44340c8147c09bab465793fecee5e65f.png)
At Universal Studios, June wait times were down 6 minutes from last year during peak hours, with most attractions featuring a lower average than the year prior. DreamWorks Land did open and help contribute by adding new experiences to lower the overall average.


In general, Mondays and Saturdays have higher wait times than the other days of the week.

Comparisons to past Junes:
-
June 2024 vs:
- Average Wait: Difference of -3.7 min / -12.6%
- June 2019: Difference of -1.1 min / -4.6%
- June 2021: Difference of -7.5 min / -25.0%
- June 2022: Difference of -7.7 min / -25.2%
- June 2023: Difference of -2.4 min / -9.4%
.png.0da3036a3c5ffd592458a357fbc3d8ab.png)


0 Comments
Recommended Comments
There are no comments to display.
Create an account or sign in to comment
You need to be a member in order to leave a comment
Create an account
Sign up for a new account in our community. It's easy!
Register a new accountSign in
Already have an account? Sign in here.
Sign In Now