Disney World July Wait Time Analysis

Entry posted by Webmaster in Data Analysis
2,876 views
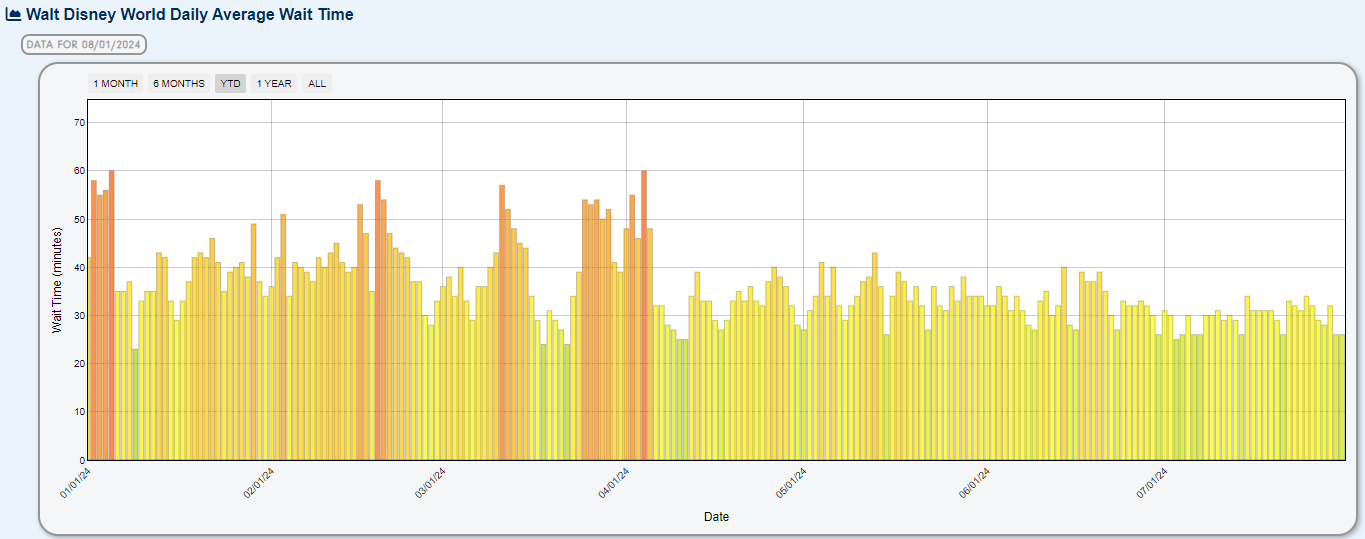
July at Walt Disney World saw a fundamental change to how guests visit the theme parks with the introduction of the Lightning Lane Passes, which brough back prebooking of attractions with Multi Passes and Single Passes that disappeared with FastPass+ in March 2020. Only a week in, it is too early to tell what difference the new system is making in terms of overall wait times. We'll have more on that in the future, but, in the mean time, we are now tracking all current and future date Lightning Lane availability. July wait times were the lowest of 2024 so far with an average wait time of 30 minutes across the resort, down 2 minutes from June. This is a decrease of 6 minutes from July of last year, and 11 minutes from before the pandemic in 2019.
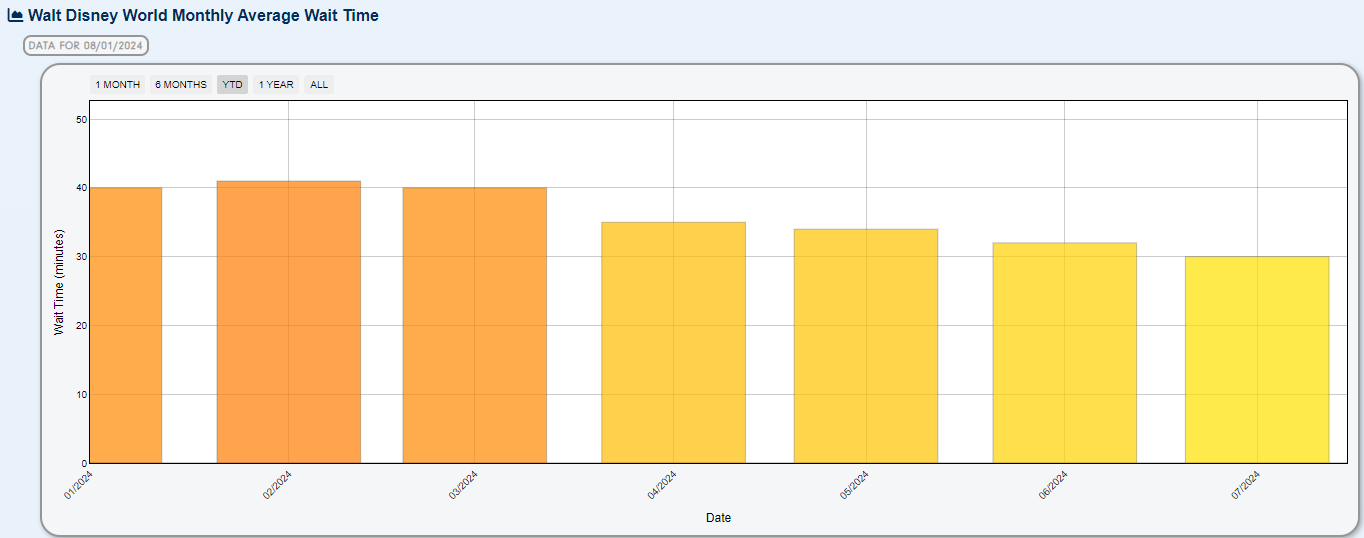
Past July Monthly Averages
- 2019: July Average Wait Time - 41 minutes
- 2020: July Average Wait Time - 14 minutes
- 2021: July Average Wait Time - 40 minutes
- 2022: July Average Wait Time - 41 minutes
- 2023: July Average Wait Time - 36 minutes
- 2024: July Average Wait Time - 30 minutes

-
July 2024 vs:
- Average Wait: Difference of -4.8 min / -12.8%
- July 2019: Difference of -17.1 min / -34.0%
- July 2020: Difference of 25.3 min / 274.4%
- July 2021: Difference of -8.7 min / -20.2%
- July 2022: Difference of -7.9 min / -19.4%
- July 2023: Difference of -3.5 min / -9.6%
Wait times at Disney's Animal Kingdom were their lowest going back to 2019 outside of the COVID reopening month of July 2020. Wednesdays and Thursdays featured the lowest wait times while Fridays had the highest. Avatar Flight of Passage had the highest average wait times but guests spent less time in line than last July.


.png.edffcf871239ee67749b892f5f0f9600.png)
-
July 2024 vs:
- Average Wait: Difference of -8.6 min / -28.0%
- July 2019: Difference of -2.6 min / -10.6%
- July 2020: Difference of 7.6 min / 50.4%
- July 2021: Difference of -3.9 min / -15.0%
- July 2022: Difference of -6.3 min / -22.8%
- July 2023: Difference of -3.5 min / -14.6%
EPCOT wait times were also lower in July than all but 2020 when going back to 2019, even with Test Track closed. The park was best avoided on Mondays with the travel transition day of Sunday featuring the lowest wait times. Remy's Ratatouille Adventure and Frozen Ever After had the longest average wait times (remember that Cosmic Rewind is still Virtual Queue and not included in the statistics).


.png.fdf5e04a3adf70f538668ec9d1525c0f.png)
-
July 2024 vs:
- Average Wait: Difference of -10.6 min / -24.2%
- July 2019: Difference of -4.5 min / -11.8%
- July 2020: Difference of 13.1 min / 60.6%
- July 2021: Difference of -9.7 min / -22.2%
- July 2022: Difference of -12.9 min / -28.0%
- July 2023: Difference of -8.8 min / -21.0%
Wait times at Disney's Hollywood Studios were down over 20% compared to July of last year. Weekends were the best time to visit the park with Monday, again, the day to avoid, if possible. Slinky Dog Dash had the highest average wait time of over 70 minutes, beating out Rise of the Resistance and the newly reopened Rock 'n' Roller Coaster.


.png.31ee0aa37eb01f3047e9c197769f4643.png)
-
July 2024 vs:
- Average Wait: Difference of -7.4 min / -26.2%
- July 2019: Difference of -14.1 min / -40.4%
- July 2020: Difference of 9.4 min / 73.8%
- July 2021: Difference of -11.9 min / -35.2%
- July 2022: Difference of -11.6 min / -35.2%
- July 2023: Difference of -5.6 min / -20.6%
At the Magic Kingdom, wait times were also down over 20% compared to last July and over 40% compared to the pre-COVID year of 2019. Weekdays were busier than the weekends by several minutes, on average. Sundays, in particular, were the lightest overall. July saw the first full month of operation for Tiana's Bayou Adventure, which is not included in these statistics as it is Virtual Queue (which also goes for TRON). This helped to lower the wait times elsewhere in the park, bringing the overall average down.


August brings back Mickey's Not So Scary Halloween Party to the Magic Kingdom, which impacts wait times there and at the other parks. We'll have more on that coming soon!
-
 1
1


0 Comments
Recommended Comments
There are no comments to display.
Create an account or sign in to comment
You need to be a member in order to leave a comment
Create an account
Sign up for a new account in our community. It's easy!
Register a new accountSign in
Already have an account? Sign in here.
Sign In Now