WDW Early September Wait Time Comparison

Entry posted by Webmaster in Data Analysis
2,711 views
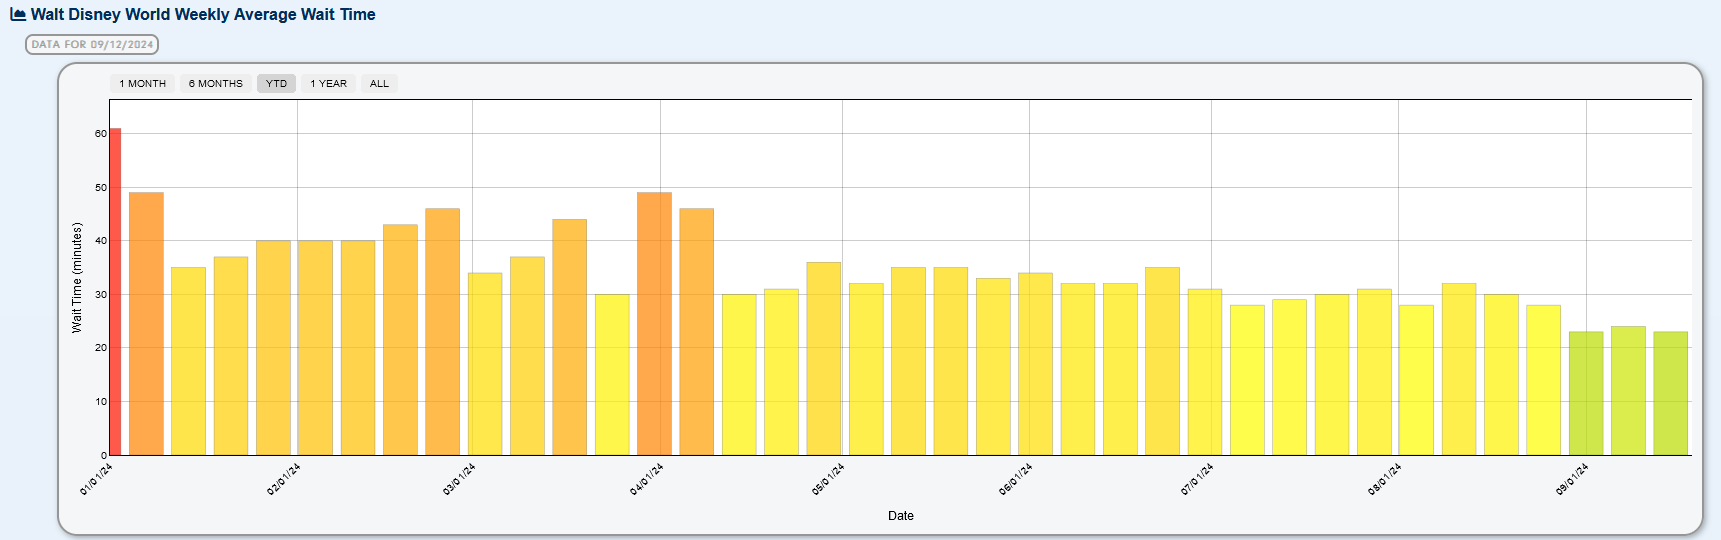
One-third of September has already come and gone across Walt Disney World. September typically has the lowest average wait time across the resort, and the data so far in 2024 has continued that trend. Primary reason why? School is back across the United States. Below, the weekly average wait time for Walt Disney World for each week in 2024 is graphed. The past two weeks and the current week are the lowest that have been seen yet. How do the wait time at each theme park compare to past years for the first one-third of September? Let's take a deeper look below.
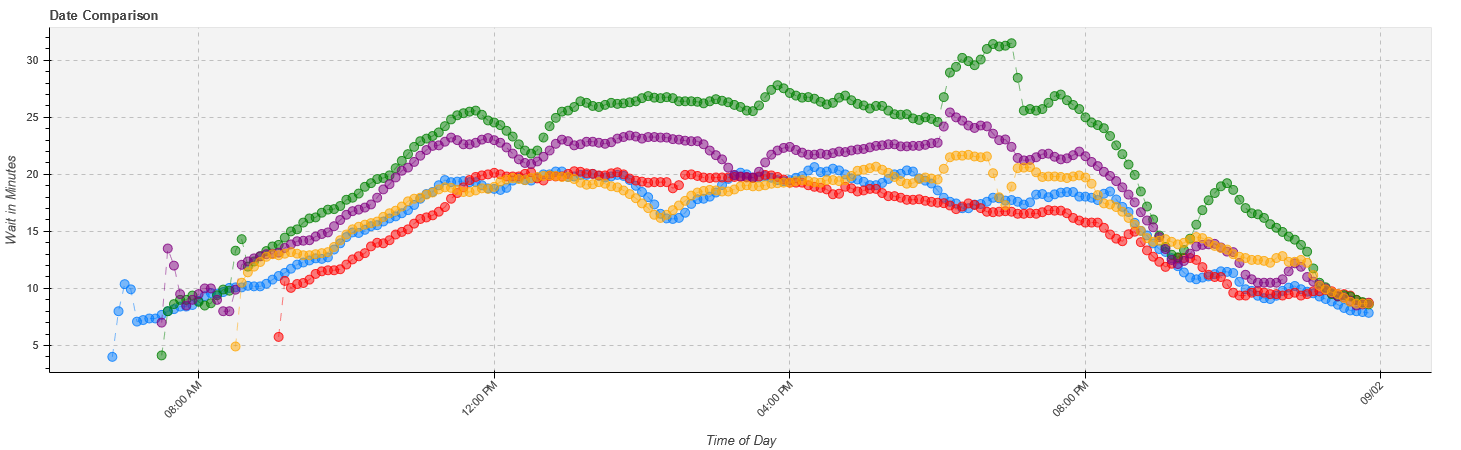
Compared to 2019 trough 2023 (with the COVID year of 2020 intentionally omitted), wait times at Disney's Animal Kingdom are up compared slightly to significantly to previous years for the first third of September.
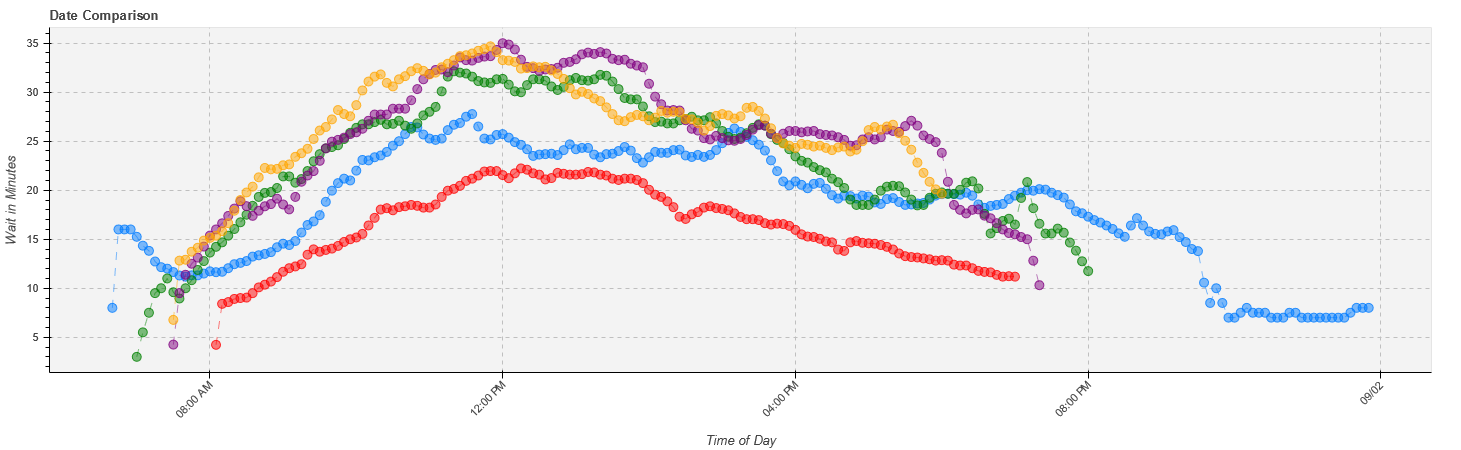
Graph Legend
- Animal Kingdom Date Range: 09/01/2019 to 09/11/2019 (solid)
- Animal Kingdom Date Range: 09/01/2021 to 09/11/2021 (solid)
- Animal Kingdom Date Range: 09/01/2022 to 09/11/2022 (solid)
- Animal Kingdom Date Range: 09/01/2023 to 09/11/2023 (solid)
- Animal Kingdom Date Range: 09/01/2024 to 09/11/2024 (solid)
-
Animal Kingdom Date Range: 09/01/2024 to 09/11/2024 vs:
- Average Wait: Difference of -11.7 min / -30.6%
- Animal Kingdom Date Range: 09/01/2019 to 09/11/2019: Difference of 5.5 min / 26.0%
- Animal Kingdom Date Range: 09/01/2021 to 09/11/2021: Difference of 10.6 min / 62.8%
- Animal Kingdom Date Range: 09/01/2022 to 09/11/2022: Difference of 2.0 min / 8.2%
- Animal Kingdom Date Range: 09/01/2023 to 09/11/2023: Difference of 0.1 min / 0.4%
Compared to 2019 trough 2023 (with the COVID year of 2020 intentionally omitted), wait times at EPCOT are up compared to 2019, 2021, and 2022, but down 14% from the first third of last September.
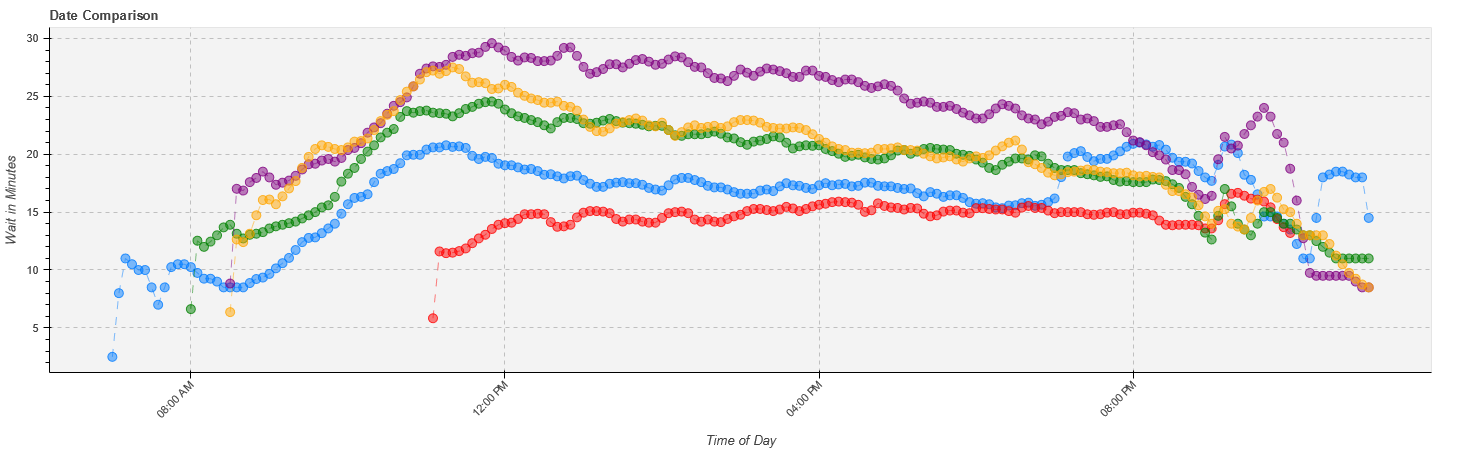
Graph Legend
- EPCOT Date Range: 09/01/2019 to 09/11/2019 (solid)
- EPCOT Date Range: 09/01/2021 to 09/11/2021 (solid)
- EPCOT Date Range: 09/01/2022 to 09/11/2022 (solid)
- EPCOT Date Range: 09/01/2023 to 09/11/2023 (solid)
- EPCOT Date Range: 09/01/2024 to 09/11/2024 (solid)
-
EPCOT Date Range: 09/01/2024 to 09/11/2024 vs:
- Average Wait: Difference of -9.1 min / -29.8%
- EPCOT Date Range: 09/01/2019 to 09/11/2019: Difference of 2.9 min / 16.8%
- EPCOT Date Range: 09/01/2021 to 09/11/2021: Difference of 6.1 min / 42.0%
- EPCOT Date Range: 09/01/2022 to 09/11/2022: Difference of 0.9 min / 4.8%
- EPCOT Date Range: 09/01/2023 to 09/11/2023: Difference of -3.3 min / -14.0%
Compared to 2019 trough 2023 (with the COVID year of 2020 intentionally omitted), wait times at Disney's Hollywood Studios are up compared to 2019 and 2021, but down 14 to 20% compared to 2022 and 2023.
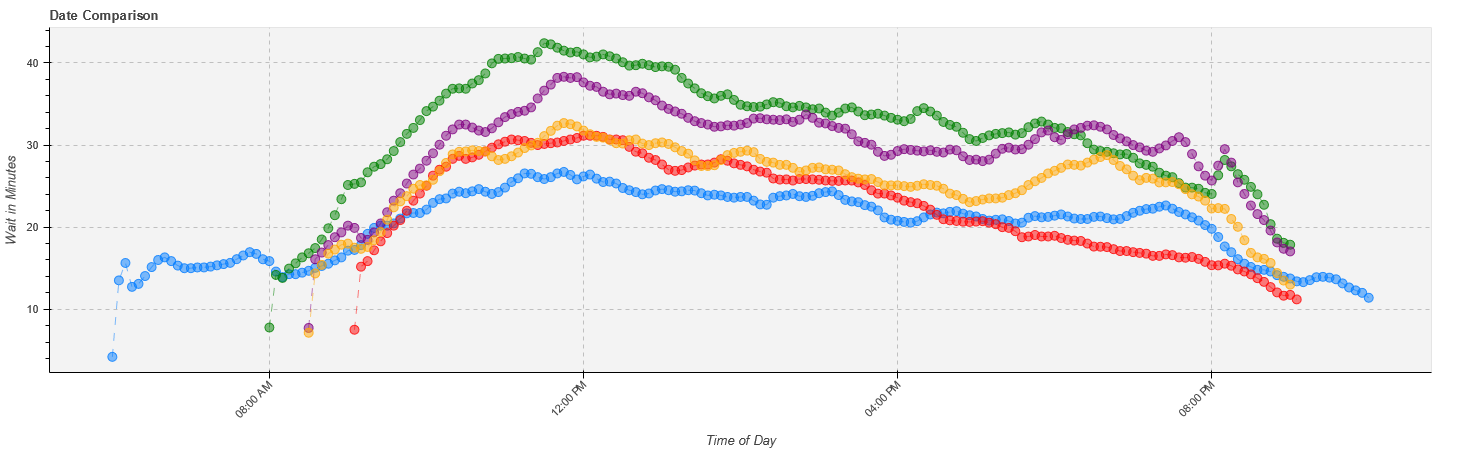
Graph Legend
- Hollywood Studios Date Range: 09/01/2019 to 09/11/2019 (solid)
- Hollywood Studios Date Range: 09/01/2021 to 09/11/2021 (solid)
- Hollywood Studios Date Range: 09/01/2022 to 09/11/2022 (solid)
- Hollywood Studios Date Range: 09/01/2023 to 09/11/2023 (solid)
- Hollywood Studios Date Range: 09/01/2024 to 09/11/2024 (solid)
-
Hollywood Studios Date Range: 09/01/2024 to 09/11/2024 vs:
- Average Wait: Difference of -16.9 min / -39.2%
- Hollywood Studios Date Range: 09/01/2019 to 09/11/2019: Difference of 3.6 min / 16.6%
- Hollywood Studios Date Range: 09/01/2021 to 09/11/2021: Difference of 3.1 min / 13.4%
- Hollywood Studios Date Range: 09/01/2022 to 09/11/2022: Difference of -7.0 min / -21.4%
- Hollywood Studios Date Range: 09/01/2023 to 09/11/2023: Difference of -4.3 min / -14.4%
Compared to 2019 trough 2023 (with the COVID year of 2020 intentionally omitted), wait times at the Magic Kingdom are up compared to 2019 and 2021, but down 11% or more compared first third of September in 2022 and 2023.
Graph Legend
- Magic Kingdom Date Range: 09/01/2019 to 09/11/2019 (solid)
- Magic Kingdom Date Range: 09/01/2021 to 09/11/2021 (solid)
- Magic Kingdom Date Range: 09/01/2022 to 09/11/2022 (solid)
- Magic Kingdom Date Range: 09/01/2023 to 09/11/2023 (solid)
- Magic Kingdom Date Range: 09/01/2024 to 09/11/2024 (solid)
-
Magic Kingdom Date Range: 09/01/2024 to 09/11/2024 vs:
- Average Wait: Difference of -11.2 min / -38.2%
- Magic Kingdom Date Range: 09/01/2019 to 09/11/2019: Difference of 0.7 min / 4.2%
- Magic Kingdom Date Range: 09/01/2021 to 09/11/2021: Difference of 1.2 min / 7.6%
- Magic Kingdom Date Range: 09/01/2022 to 09/11/2022: Difference of -5.1 min / -23.4%
- Magic Kingdom Date Range: 09/01/2023 to 09/11/2023: Difference of -2.1 min / -11.0%
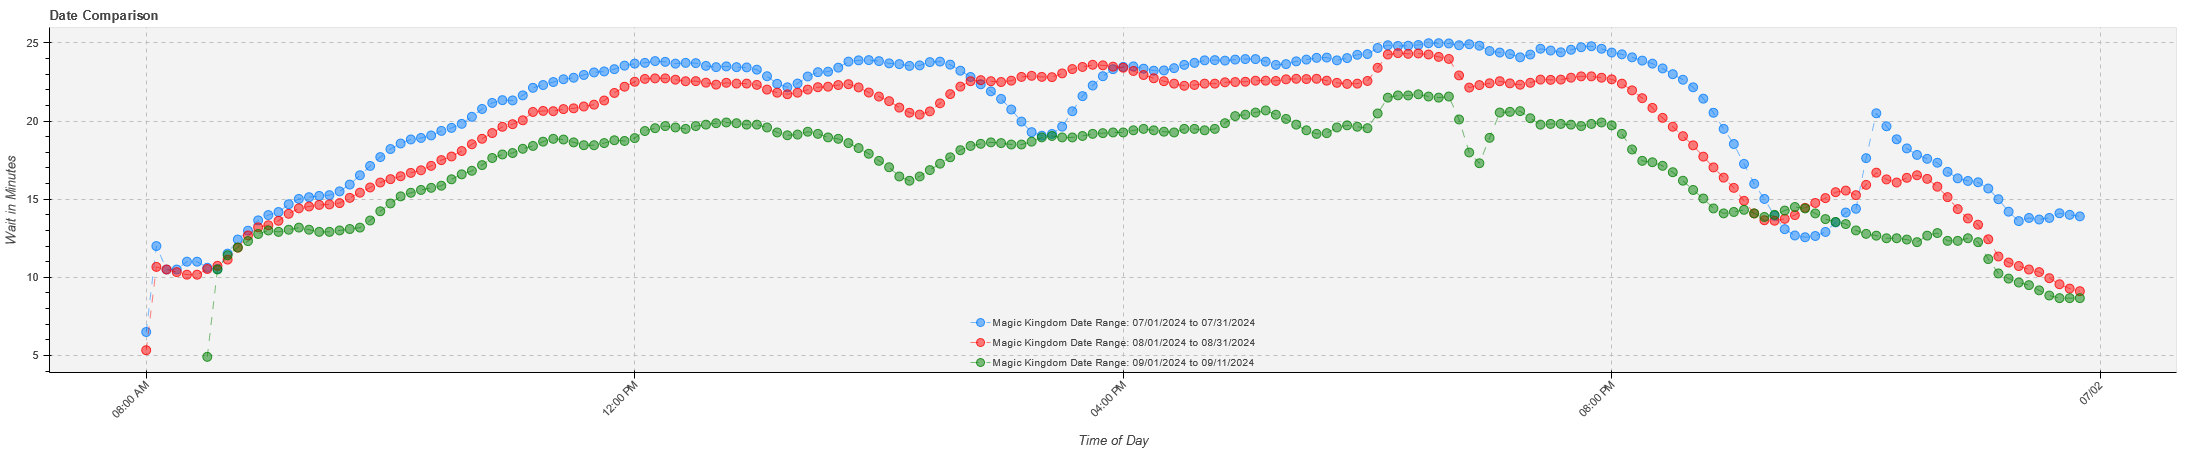
At the Magic Kingdom, early September wait times are down about 13% from August of this year, and 18% from July of this year. The Halloween Parties definitely play a factor when comparing September and August to July though.
-
Magic Kingdom Date Range: 09/01/2024 to 09/11/2024 vs:
- Average Wait: Difference of -11.2 min / -38.2%
- Magic Kingdom Date Range: 07/01/2024 to 07/31/2024: Difference of -3.8 min / -18.4%
- Magic Kingdom Date Range: 08/01/2024 to 08/31/2024: Difference of -2.5 min / -13.0%


0 Comments
Recommended Comments
There are no comments to display.
Create an account or sign in to comment
You need to be a member in order to leave a comment
Create an account
Sign up for a new account in our community. It's easy!
Register a new accountSign in
Already have an account? Sign in here.
Sign In Now