-
Posts
1,478 -
Joined
-
Last visited
-
Days Won
24
Content Type
Profiles
Forums
Gallery
Events
How-To
Blogs
Everything posted by Webmaster
-
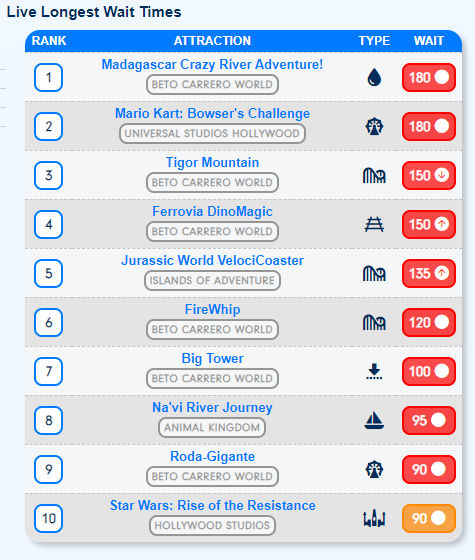
6:20 PM Update Kennywood: now with wait times on the site! https://www.thrill-data.com/waits/park/additional-parks-america/kennywood/ 4:00 PM Update Disney World wait times today (black line) compared to other July 22nd's going back to 2014 2:05 PM Update July 22nd at Disneyland going back to 2019. Today is the black line. 1:45 PM Update An above average Saturday at Busch Gardens Tampa. Very hot out there. 1:00 PM Update Some big wait time numbers today at Hershey Park 12:35 PM Update Mario Kart: Bowser's Challenge at Universal Studios Hollywood has an average wait time of 112 minutes (nearly 2 hours) since opening! Posting a 3 hour wait today. 10:20 AM Update Thunder Mountain at Disneyland Paris is posting a 300 minute wait? 9:40 AM Update The trend of lower Genie+ prices on the weekend continues 9:20 AM Update It is a hot July Saturday around the world. We will be following any noteworthy action throughout the day here. These are the current longest wait times around the world
-
How can more accurate wait time data be obtained? By users submitting the amount of time they actually wait in time at theme park!
-
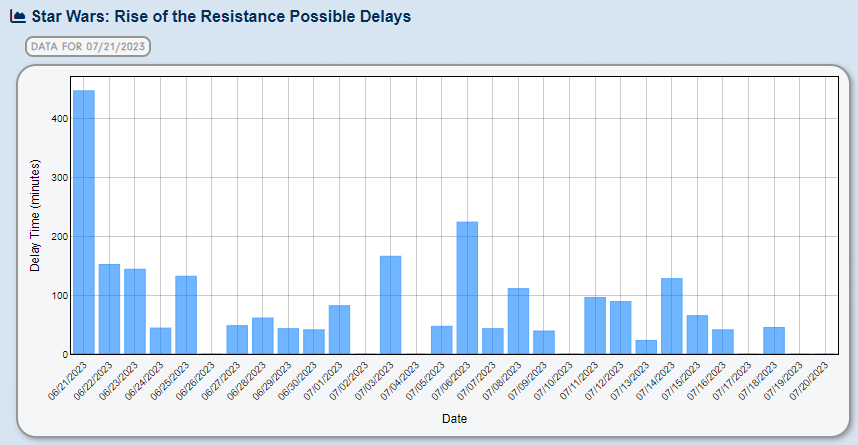
Over the past month, Star Wars: Rise of the Resistance at Disney's Hollywood Studios has been operating more often that the previous month with only one day of extreme down time. https://www.thrill-data.com/waits/attraction/hollywood-studios/starwarsriseoftheresistance/#delays
-
It will be interesting to see if it actually comes to fruition. Don't see it being a big market at all.
-
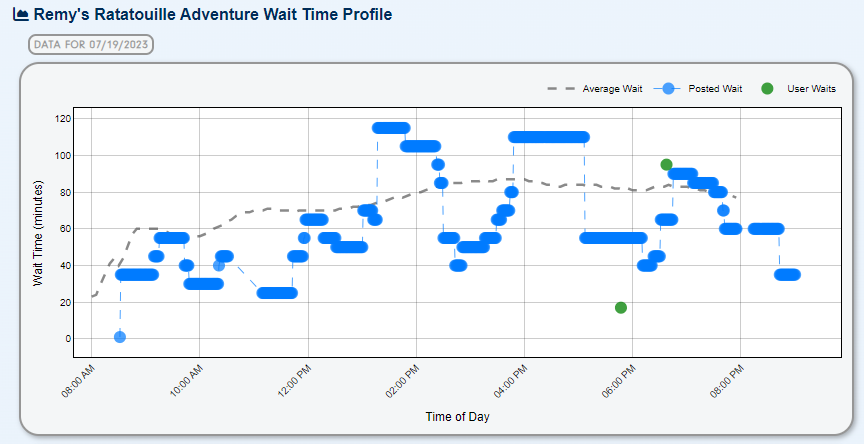
Some interesting data for Remy's Ratatouille Adventure yesterday evening. At 5:47 PM, a user reported a 17 minute wait against a 55 minute posted wait time. At 6:37 PM, a user reported a 95 minute wait against a 90 minute posted wait time. This goes to show, that while wait time can be quite off, they can be more accurate as attractions get flooded with guests after posting a lower wait time.
-
If you are looking to spend less time waiting in line at Disneyland Resort, which includes Disneyland Park and Disney California Adventure, what days should you go to, on average, spend less time in line? Let's take a look at the data so far this year. Resort wide, your best bet is to visit on a Friday. If you can only visit on the weekend, try to visit on a Sunday. The data says the worst days to go are Monday through Wednesday, all at an average wait time of 34 minutes. The difference between the best day and worst days is 4 minutes. At Disneyland Park, on average, Sundays have the shortest wait times while Mondays have the longest. There is a 6 minute time difference between the two. At Disney California Adventure, Fridays and Saturdays have the lowest wait times. Tuesdays and Wednesdays typically have the longest wait times. Wait times resort wide have not varied considerably month to month this year. July is trending as the slowest month so far.
-
Which type of roller coaster do you prefer more?
-
If you are looking to spend less time waiting in line at Universal Orlando, what days should you go to, on average, spend less time in line? Let's take a look at the data so far this year. Resort wide, your best bet is to visit on a Wednesday. If you can only visit on the weekend, try to visit on a Sunday. Like Disney World, Mondays have also been pretty busy. The difference in wait times between Saturday and Wednesday is about 7 minutes. At Islands of Adventure, just about every day except Saturday has an equal average. At Universal Studios Florida, there is a bit more variation, but Wednesday and Thursday have the lowest wait times. Saturday and Monday have the highest wait times, on average. This year, resort wide monthly averages have been pretty consistent outside of a May and early June slump. Make sure to follow the Universal Orlando page on the site for the latest data and trends: https://www.thrill-data.com/waits/chain/uor/
-
Hopefully will be able to do another soon!
-
When the attraction does open, you will be able to track its posted wait times at https://www.thrill-data.com/waits/attraction/universal-studios/villainconminionblast/
-
It's another busy Monday at theme parks out there. 6:00 PM Update Wait times at Disneyland on its birthday The longest wait times this Monday afternoon 12:30 PM Update Steel Vengeance at Cedar Point is posting its highest wait time of the year so far Wait times are up today at each Disney World theme park Islands of Adventure is on the busy side
-
Disneyland opened on this day in 1955!
-
Some member reported waits for Villain-Con Minion Blast at Universal Studios Florida from yesterday. The ride is in technical rehearsals. 25 minutes 20 minutes 21 minutes
-
This week (7/10 to 7/16/2023), wait times across Walt Disney World were up 2 minutes over last week to 35 minutes. Out of the past 80 weeks, this week would rank #58. The same week last year ranks #28 with an average wait time of 42 minutes. The attraction with the longest wait time by average was Avatar Flight of Passage These were the hardest Lightning Lane slots for each park: Animal Kingdom EPCOT Hollywood Studios Magic Kingdom
-

Saturday July 15th Wait Time Happenings
Webmaster replied to Webmaster's topic in Wait Time Discussions
Today’s updates were posted at -
How busy (or not) Disney World has been in July (and really all of 2023) is a hot topic the past few weeks. There have been numerous articles in high profile outlets (including CNN, which cited data from Thrill Data) to talk about it, and plenty of debate about it on Reddit and other groups. Is it possible to determine how busy Disney actually is right now? The short answer is no. We are simply not privy to the attendance data that would tell us so. However, utilizing wait time data and other indicators, we can make a pretty good hypothesis that crowds are lower this summer. But if you are visiting the parks soon, this is good news for you! What the Disney Wait Time Data Says We record the Disney wait time data all day, every day directly from the My Disney Experience app. This is what Disney "posts" as the official wait time of each attraction. While the accuracy of these times vary (see below), you can assume that the same inaccuracy always exists over time, allowing you to look for trends in data over time. Think about it this way with an example: on a slower day, the posted wait time for an attraction is 10 minutes, but the actual wait time is only 5 minutes; on a busier day, the posted wait time for the same attraction is 20 minutes, but the actual wait time is 10 minutes. Disney has differentiated the busier day from the slower day with the posted wait time, even if the posted wait times are not accurate. With this in mind, we can take a look at some of the 2023 Walt Disney World wait time data to see what trends we can find. Keep in mind that wait times in 2019 and below had FastPass+, wait times in 2021 did not have Genie+/Individual Lightning Lane until October, and wait times in 2022/2023 had Genie+/Individual Lightning Lane. The Big Picture (January to July since 2019) These graphs below plot the average wait time at each point in the day for each day from 2019 to now, separated by year. If we look at how wait times to this point in the year compare going back to 2019, it is clear that this year, the purple line, is lower than last year (green line) in most cases. EPCOT is the closest to 2022, and is ahead of 2019 (likely thanks to its new attractions that had not opened at this point in 2019). Magic Kingdom wait times are down over 15% compared to 2019 and 2022. Disney's Hollywood Studios wait times this year are higher than 2019 (Rise of the Resistance likely a big contributor), but lower than last year. Disney's Animal Kingdom wait times are well down from 2019, likely with the newness of Pandora wearing off (and Flight of Passage not posting consistent 3 to 4 hour waits). Disney's Animal Kingdom: January 1st to July 15th Wait Time Comparison 2019 was really peak for Disney's Animal Kingdom 2019: blue 2021: red 2022: green 2023: purple EPCOT: January 1st to July 15th Wait Time Comparison EPCOT had those 11 AM openings in 2021 2019: blue 2021: red 2022: green 2023: purple Disney's Hollywood Studios: January 1st to July 15th Wait Time Comparison 2019: blue 2021: red 2022: green 2023: purple Magic Kingdom: January 1st to July 15th Wait Time Comparison There is a big delta between '19/'22 and '23 at the Magic Kingdom 2019: blue 2021: red 2022: green 2023: purple Near Term (June 2023 Analysis) If we take a closer look at an individual month, we can see what attractions are causing the biggest changes to each park. Outside of the Magic Kingdom, the parks are generally offering the same attractions lineup as last year. 2022 is blue and 2023 is red in the following graphs. All of the major attractions at Disney's Animal Kingdom had lower wait times in June '23 than June '22, with Flight of Passage and the Safari causing the largest delta. EPCOT wait times are just slightly lower in '23 than '22 except for Mission: Space and Meeting Anna & Elsa, which is well below June last year. Test Track is matching last year. At Disney's Hollywood Studios, Rise of the Resistance, Smuggler's Run, and Tower of Terror are leading the drop in the overall wait times. Slinky Dog Dash and Runaway Railway were slightly up in June '23. At the Magic Kingdom, Seven Dwarfs Mine Train, Peter Pan's Flight, Space Mountain, and Haunted Mansion actually had higher wait times in June '23 than '22. Most of the other attractions were slightly less than last year. One factor reducing Magic Kingdom wait times are more ride offerings. The graph below shows the attractions (ignore Under the Sea there) that operated in June '23 but not in June '22. 4th of July The 4th of July weekend this year was quite shocking. From Saturday the 1st through the 4th, wait times were below most years going back to 2014! The black line was this year. It should be noted that the current ticket deals were blocked out as were many Passholders. For July 1st, '23 was only above '16 For July 2nd, '23 was again only ahead of '16 July 3rd '23 was a bit more average, but well below '17, '18, and '22 July 4th set a new low bar for the holiday (at least going back to 2014) for most of the day. What Reported Wait Time Data Says Over the past week, users have been reporting their times waiting in line across Walt Disney World. We've pulled some of the most interesting cases where the posted wait time did not match well with the actual time guests spent waiting in line. Quite a few times in the list where the wait was minimal but the posted wait time was high. If wait times were more accurate, this data seems to indicate that average wait times would actually be less than you saw in the analyses above. Remy's Ratatouille Adventure: Posted 60 minutes, 30 minutes Actual Soarin' Around the World: Posted 30 minutes, 2 minutes Actual Pirates of the Caribbean: Posted 20 minutes, 11 minutes Actual Big Thunder Mountain Railroad: Posted 30 minutes, 20 minutes Actual The Many Adventures of Winnie the Pooh: Posted 30 minutes, 13 minutes Actual Peter Pan's Flight: Posted 25 minutes, 15 minutes Actual Space Mountain: Posted 30 minutes, 3 minutes Actual Meet Anna and Elsa: Posted 20 minutes, 5 minutes Actual Frozen Ever After: Posted 60 minutes, 52 minutes Actual Space Mountain: Posted 65 minutes, 37 minutes Actual Soarin' Around the World: Posted 10 minutes, 20 minutes Actual Slinky Dog Dash: Posted 95 minutes, 86 minutes Actual Rise of the Resistance: Posted 70 minutes, 84 minutes Actual Soarin' Around the World: Posted 20 minutes, 25 minutes Actual Remy's Ratatouille Adventure: Posted 60 minutes, 35 minutes Actual P.S. Remember to record your wait times during your visits too. Just click the button pictured at right on any attraction page to get started What Other Indicators Say If demand is strong, typically there are few offers or incentives to visit the parks. Right now, there are quite a few offers and deals to entice visitors, which indicates that demand has slowed. Right now, you can visit all 4 theme parks for less than price of a single day Park Hopper ticket on days Disney deems higher demand (or reference, it cost my parents over $500 for a 1 Day Park Hopper the day before Easter this year). Hotel & Ticket Promotions Hotels are offering 30% off and sometimes more this summer and fall Florida Residents: Purchase a 4-Day Disney Summer Magic Ticket for Just $58 Per Day, Plus Tax (Total Price: $229 Plus Tax) 4-Day, 4-Park Magic Ticket – $99 Per Day, Plus Tax (Total Price: $396 Plus Tax) Park Pass Reservation Availability No sold out days are in sight the rest of the summer Guest Observations Many guests report being surprised at the lack of congestion at times on the parks' pathways Based on the wait time data, current discounts, and observations, it seems logical to conclude that Disney World is less busy so far in 2023. This does not mean that the parks are empty (and they're aren't by any stretch). Certain parks and pathways in the parks will still be congested, but some may be lighter. Most restaurants will still be hard to get reservations for, but you might have a better chance than last year. You should spend less time waiting in regular standby lines than you would have last year, which should make for a more enjoyable trip. There will be cases were they are high due to delays, weather, and other things. But overall, it should be a bit less busy. If you've been holding off on a trip, now might be better than ever to go!
-
Welcome to the last day of the weekend! Crazy it is already mid-July. 6:30 PM Update A busy Sunday at Kings Island after a rainy Saturday 12 PM Update Disney World wait times are trending their lowest of the past week (black line). Storms expected later today. Wait times at Universal Orlando have been pretty consistent this week 10 AM Update Around the world today, Alton Towers wait times are up compared to yesterday, but lower than other days this week. https://www.thrill-data.com/waits/park/merlin/alton-towers/ Disneyland Paris wait times are not bad for a holiday weekend https://www.thrill-data.com/waits/park/dis/disneyland-paris/ Asian theme parks are dominating the list of longest average wait times
-

Cedar Point Wait Time Comparison: '19, '21, '22, & '23
Webmaster replied to Webmaster's topic in Wait Time Discussions
2021 was a mess with limited capacity and not all rides open. -

Saturday July 15th Wait Time Happenings
Webmaster replied to Webmaster's topic in Wait Time Discussions
-

Saturday July 15th Wait Time Happenings
Webmaster replied to Webmaster's topic in Wait Time Discussions
Disney World wait times are trending on the higher end of recent Saturdays https://www.thrill-data.com/waits/chain/wdw/ -
VelociCoaster with only a 35 minute wait early on today https://www.thrill-data.com/waits/attraction/islands-of-adventure/jurassicworldvelocicoaster/
 THRILL DATA Community


.png.be9c006a6eaf4162739e57c0ffc44ede.png)
.png.52c2596f57e992a1d876e710e92ce3cc.png)


.png.da8805cc165c79422bc1ec7ec516a1b4.png)