Webmaster
-
Posts
1,478 -
Joined
-
Last visited
-
Days Won
24
Content Type
Profiles
Forums
Gallery
Events
How-To
Blogs
Everything posted by Webmaster
-

-
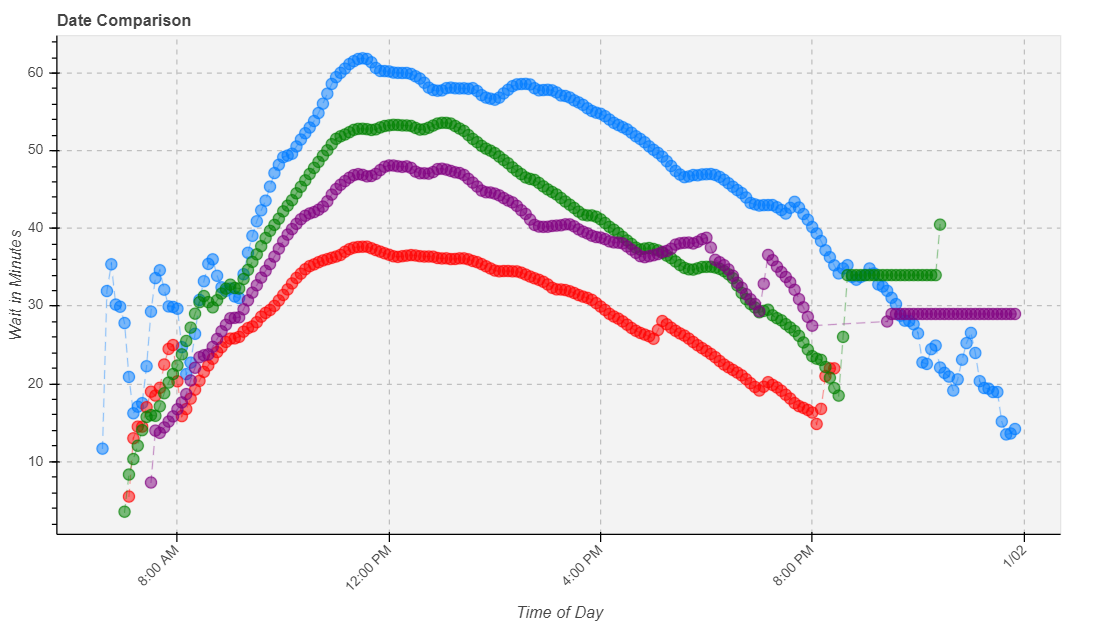
 These are the wait time averages for each Dollywood January 1st to July 13th going back to 2019. 2020 is excluded on purpose due to COVID. Dollywood 2019: blue 2021: red 2022: green 2023: purple
-
These are the wait time averages for Universal Studios Hollywood January 1st to July 13th going back to 2019. 2020 is excluded on purpose due to COVID. Universal Studios Hollywood 2019: blue 2021: red 2022: green 2023: purple
-
These are the wait time averages for each Kings Island from January 1st to July 13th going back to 2019. 2020 is excluded on purpose due to COVID. Kings Island 2019: blue 2021: red 2022: green 2023: purple
-
Disneyland Resort Wait Time Comparison: '19, '21, '22, & '23
Webmaster replied to Webmaster's topic in Wait Time Discussions
Notice in particular that DCA is pretty close to 2019 wait times this year and Disneyland 2023 is above 2019. -
These are the wait time averages for each Disneyland theme park January 1st to July 13th going back to 2019. 2020 is excluded on purpose due to COVID. California Adventure 2019: blue 2021: red 2022: green 2023: purple Disneyland 2019: blue 2021: red 2022: green 2023: purple
-
These are the wait time averages for Cedar Point January 1st to July 13th going back to 2019. 2020 is excluded on purpose due to COVID. Cedar Point 2019: blue 2021: red 2022: green 2023: purple
-
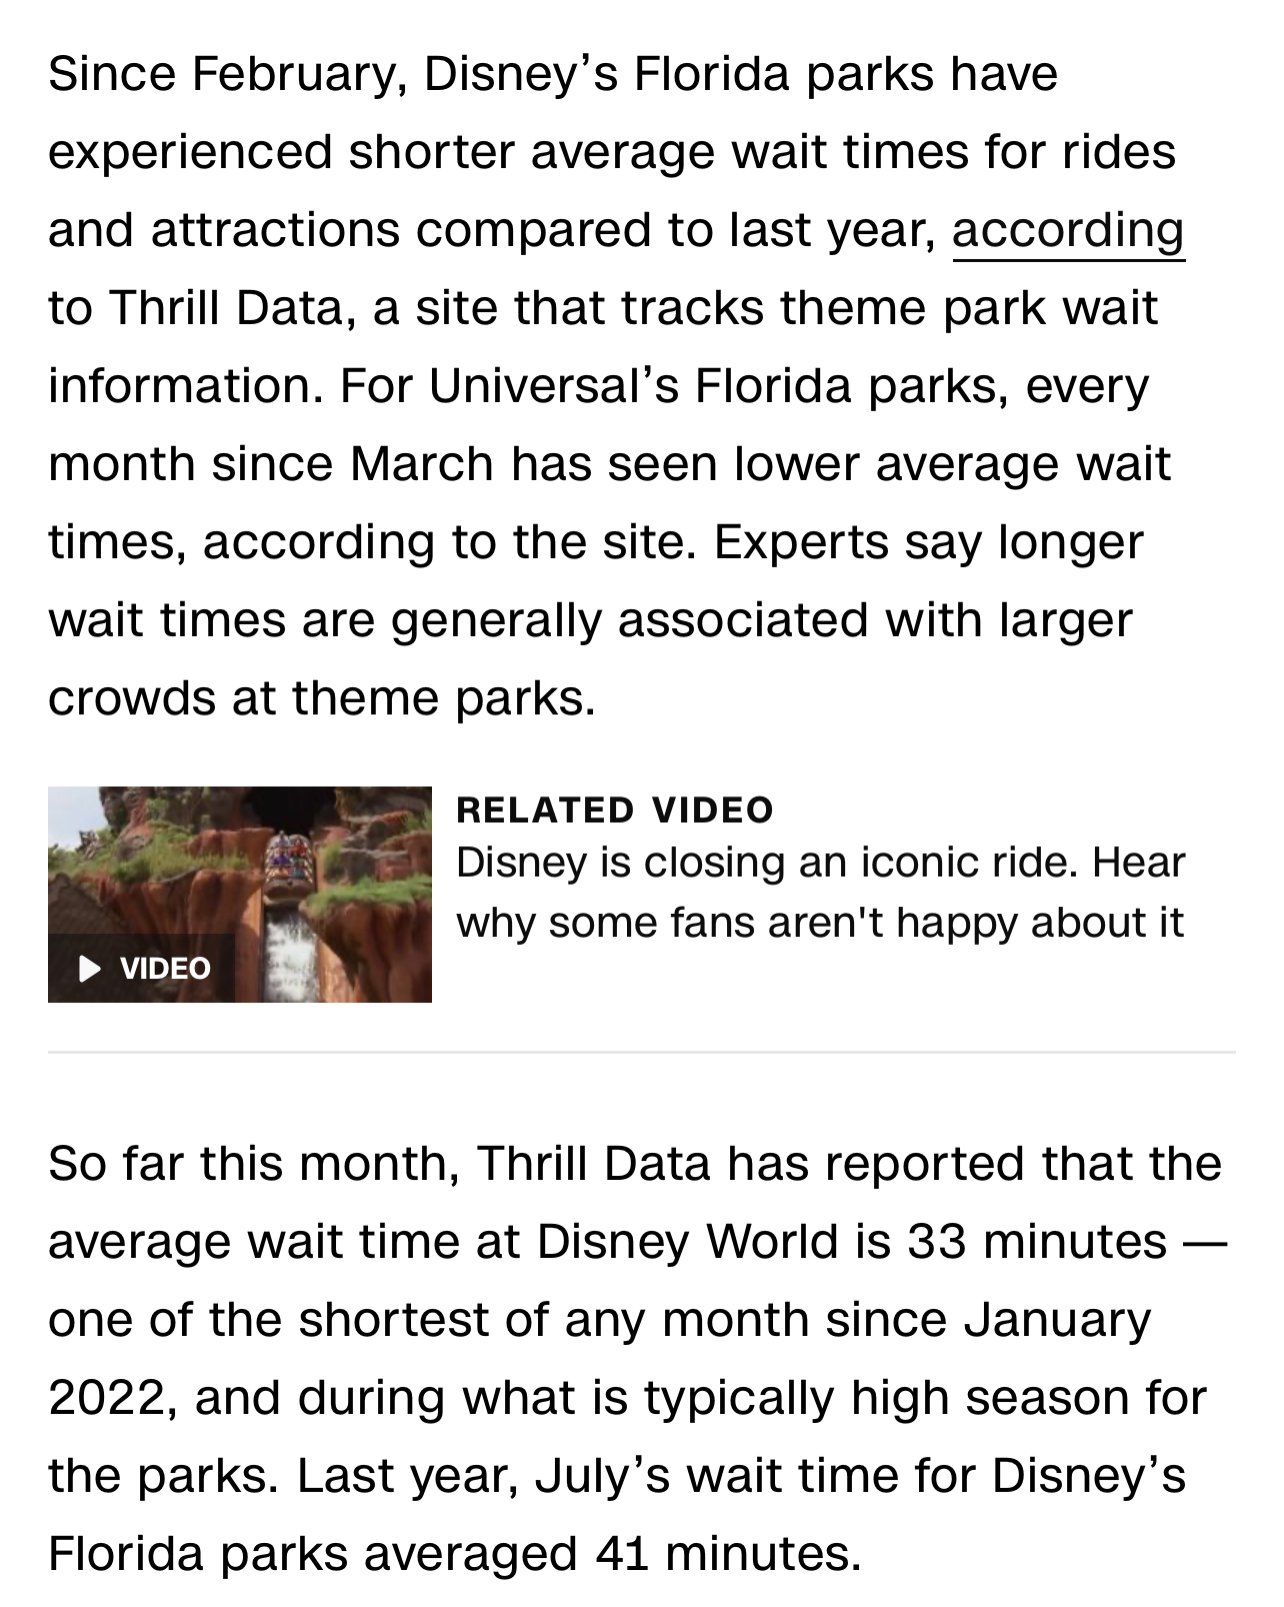
We were cited on CNN today:
-
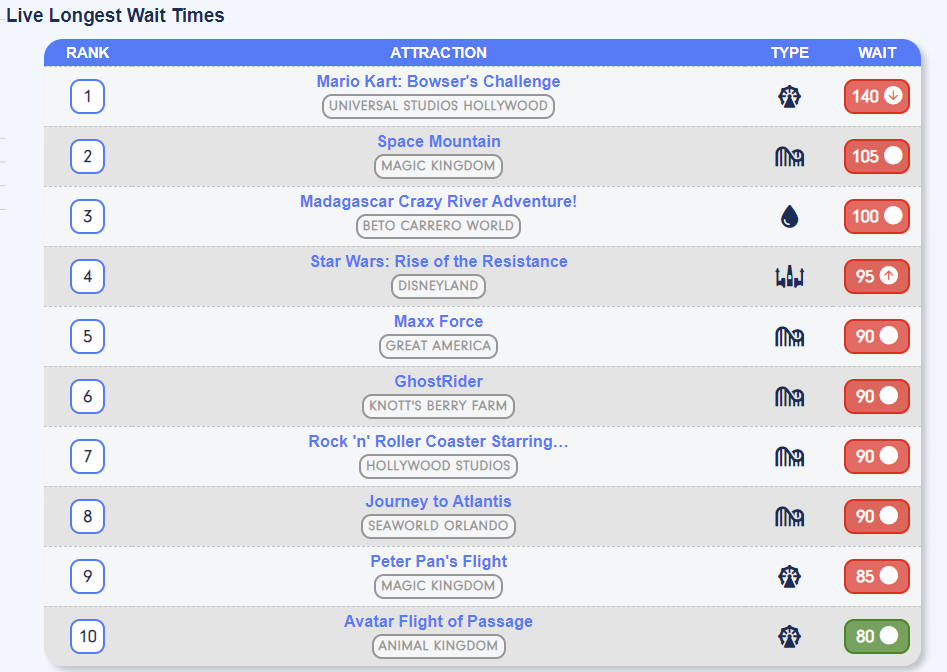
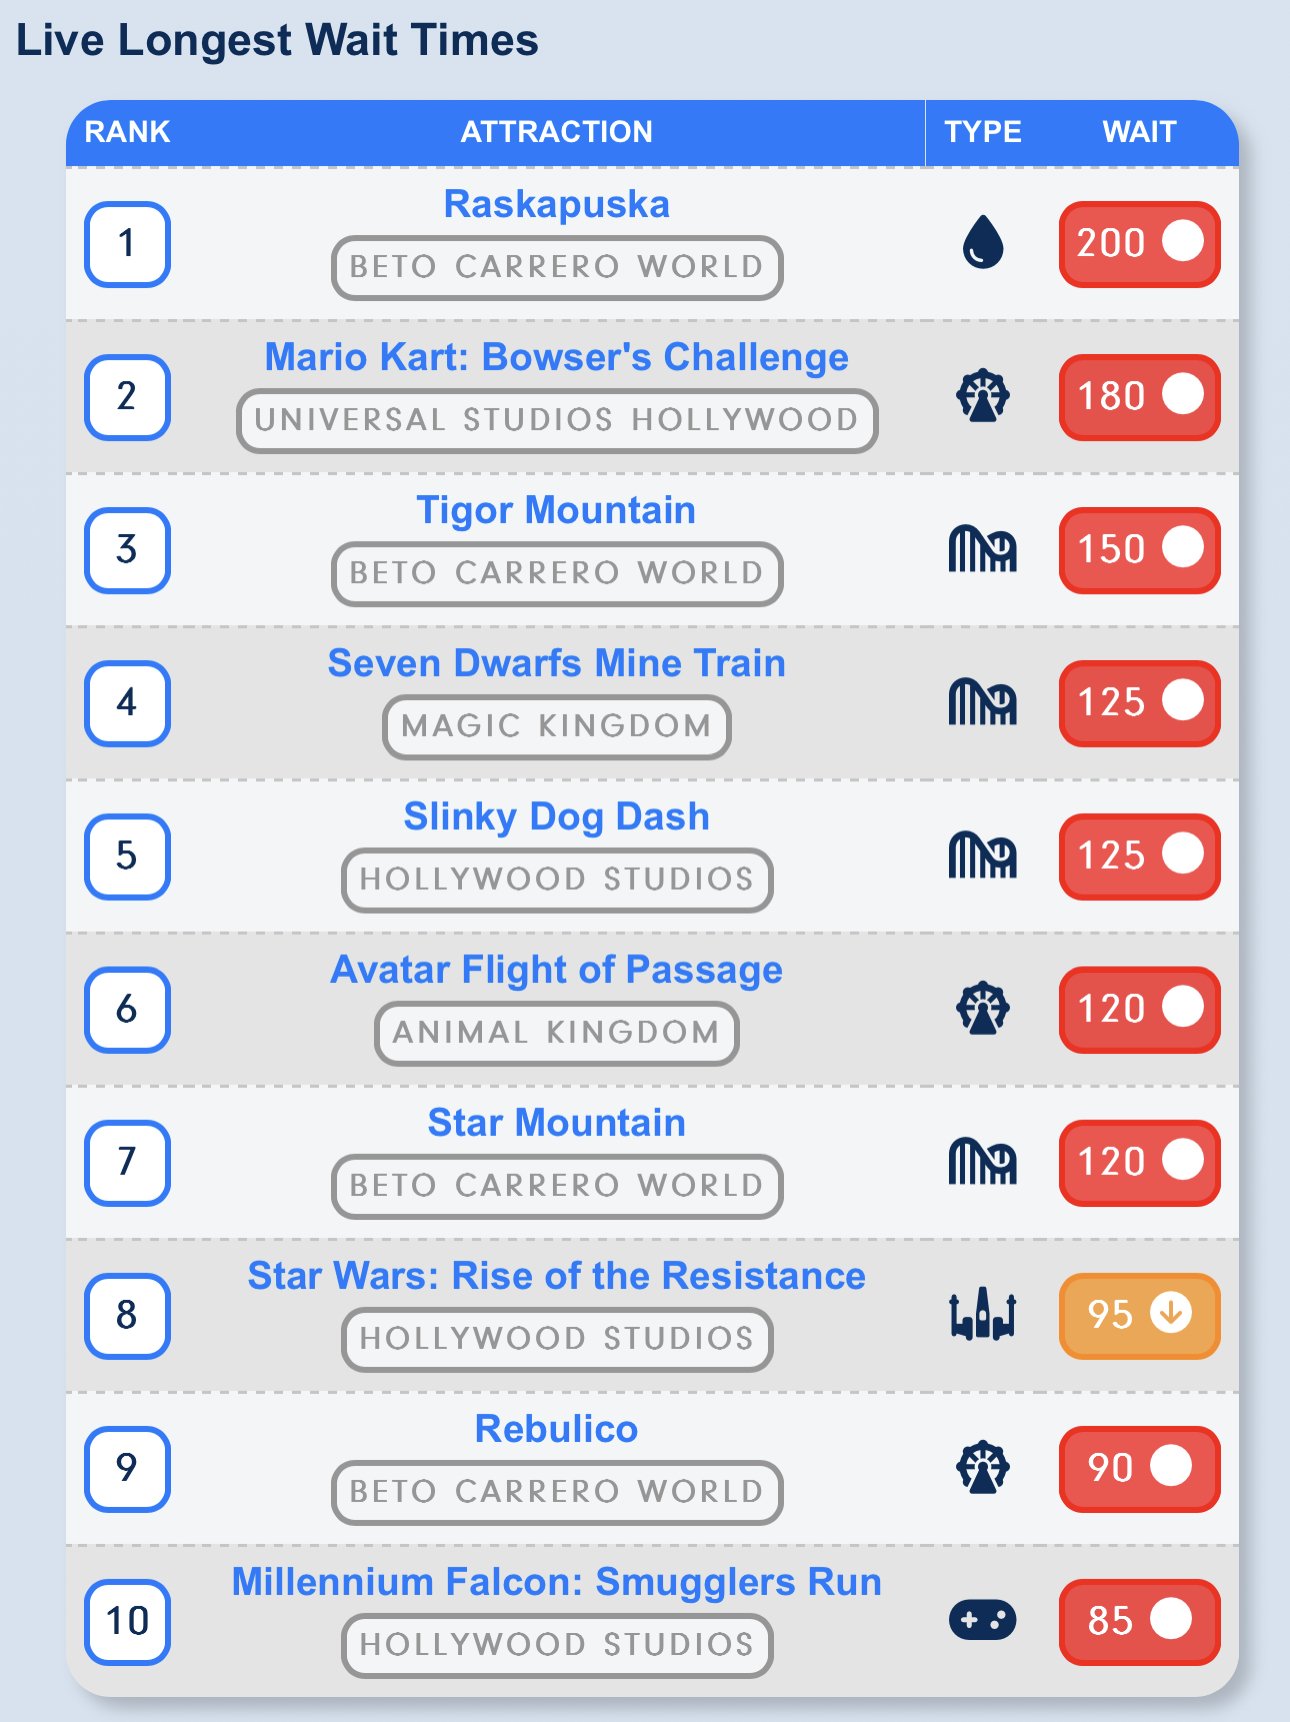
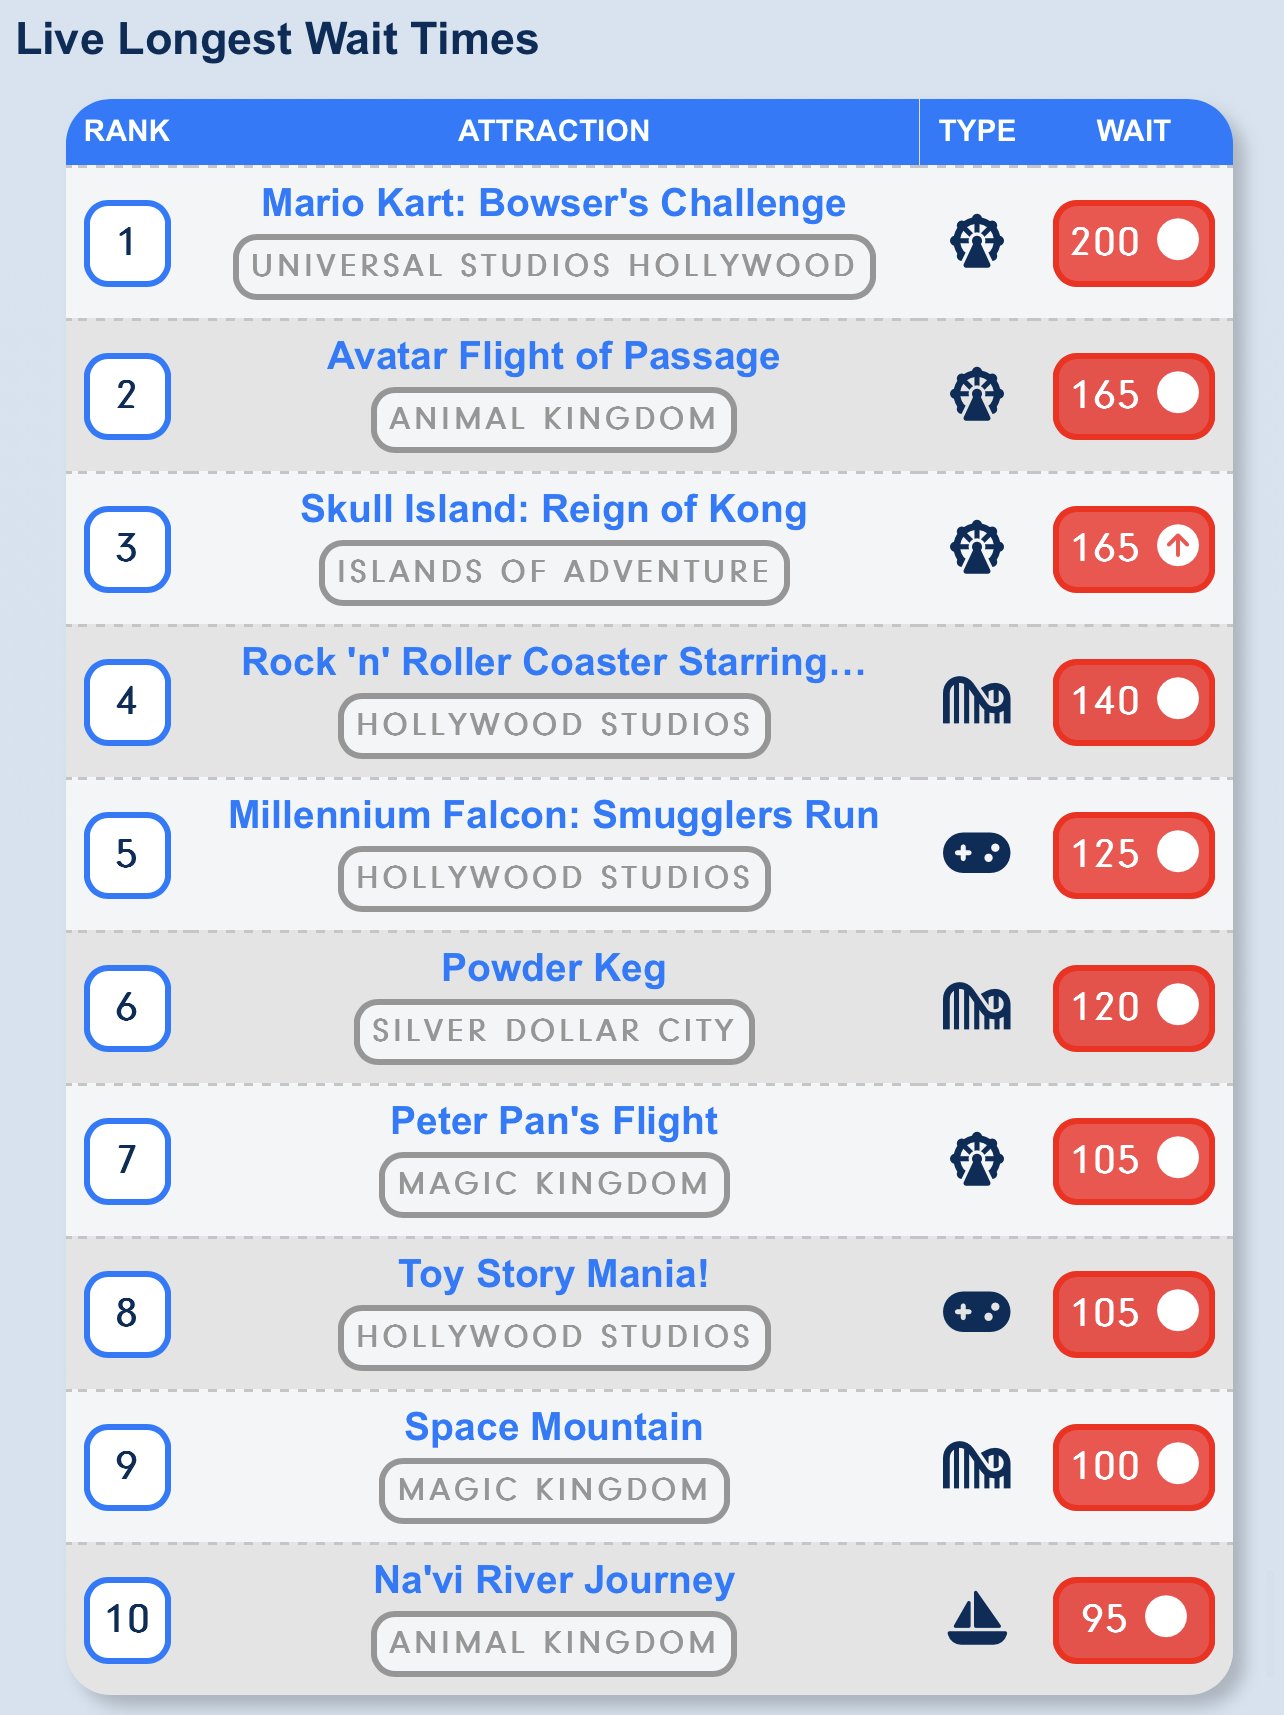
The current longest Thursday wait times
-
The longest wait times this afternoon/evening
-
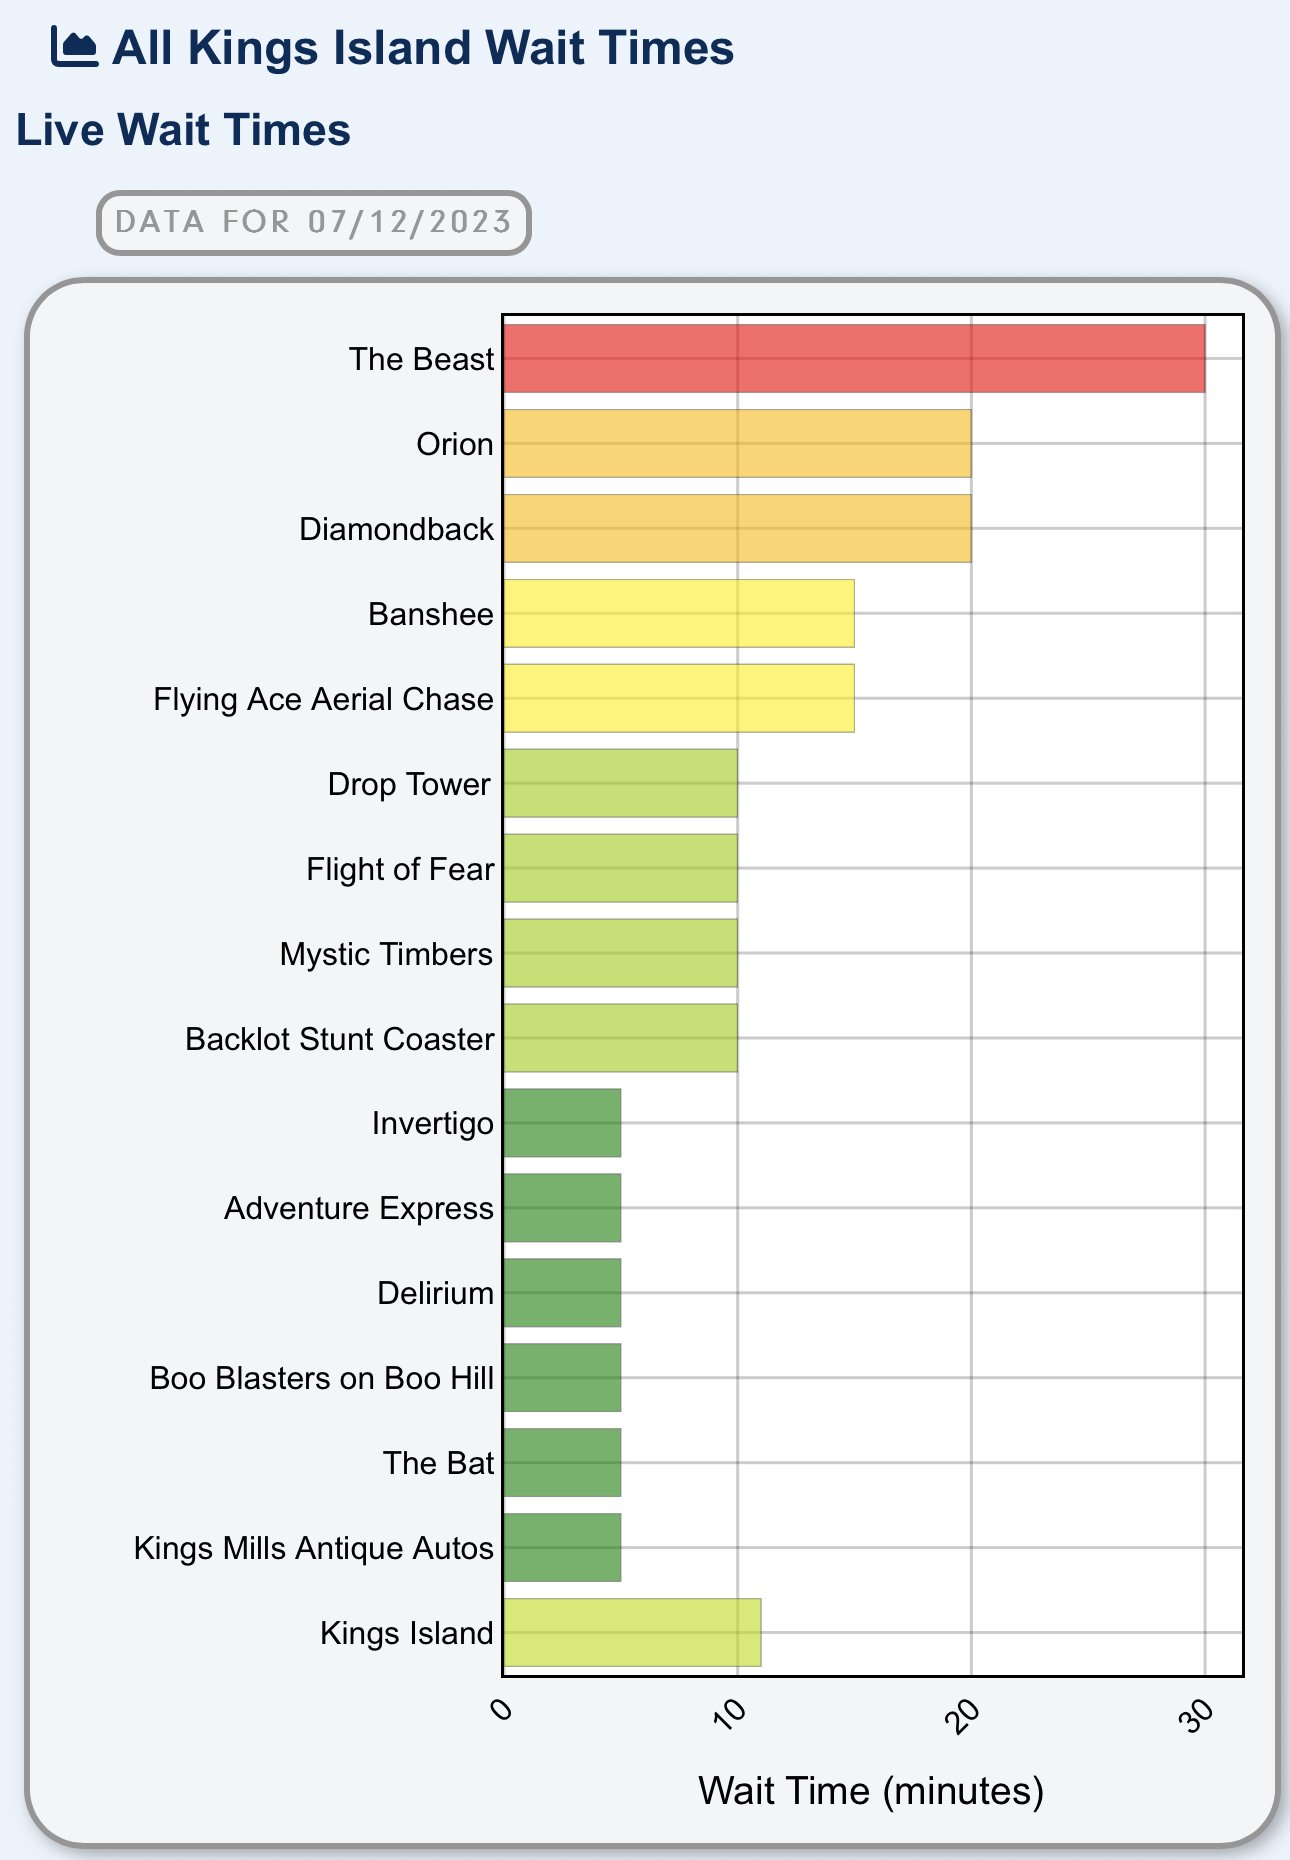
Kings Island wait times are low so far
-
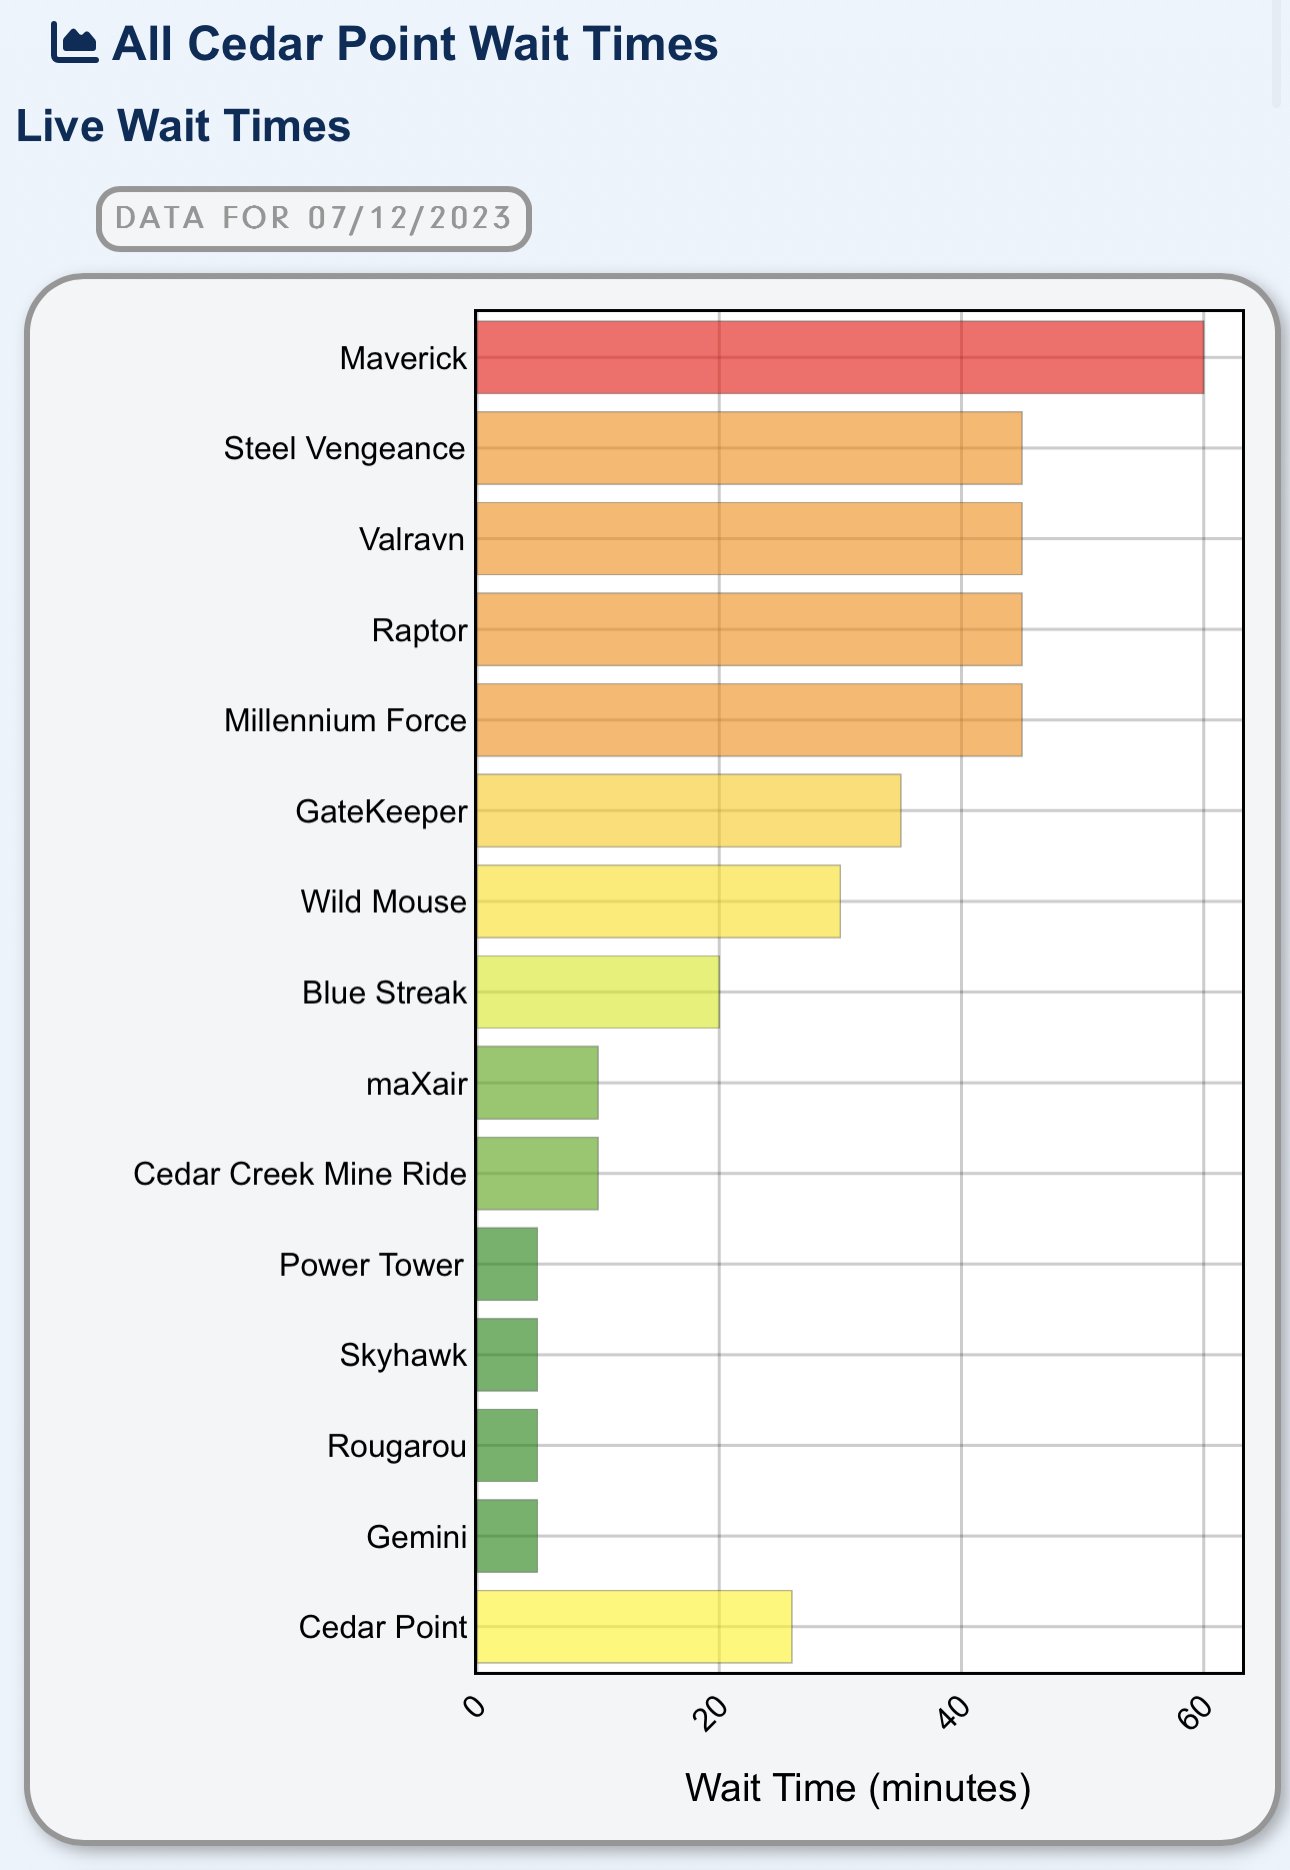
Cedar Point posted wait times are reasonable
-
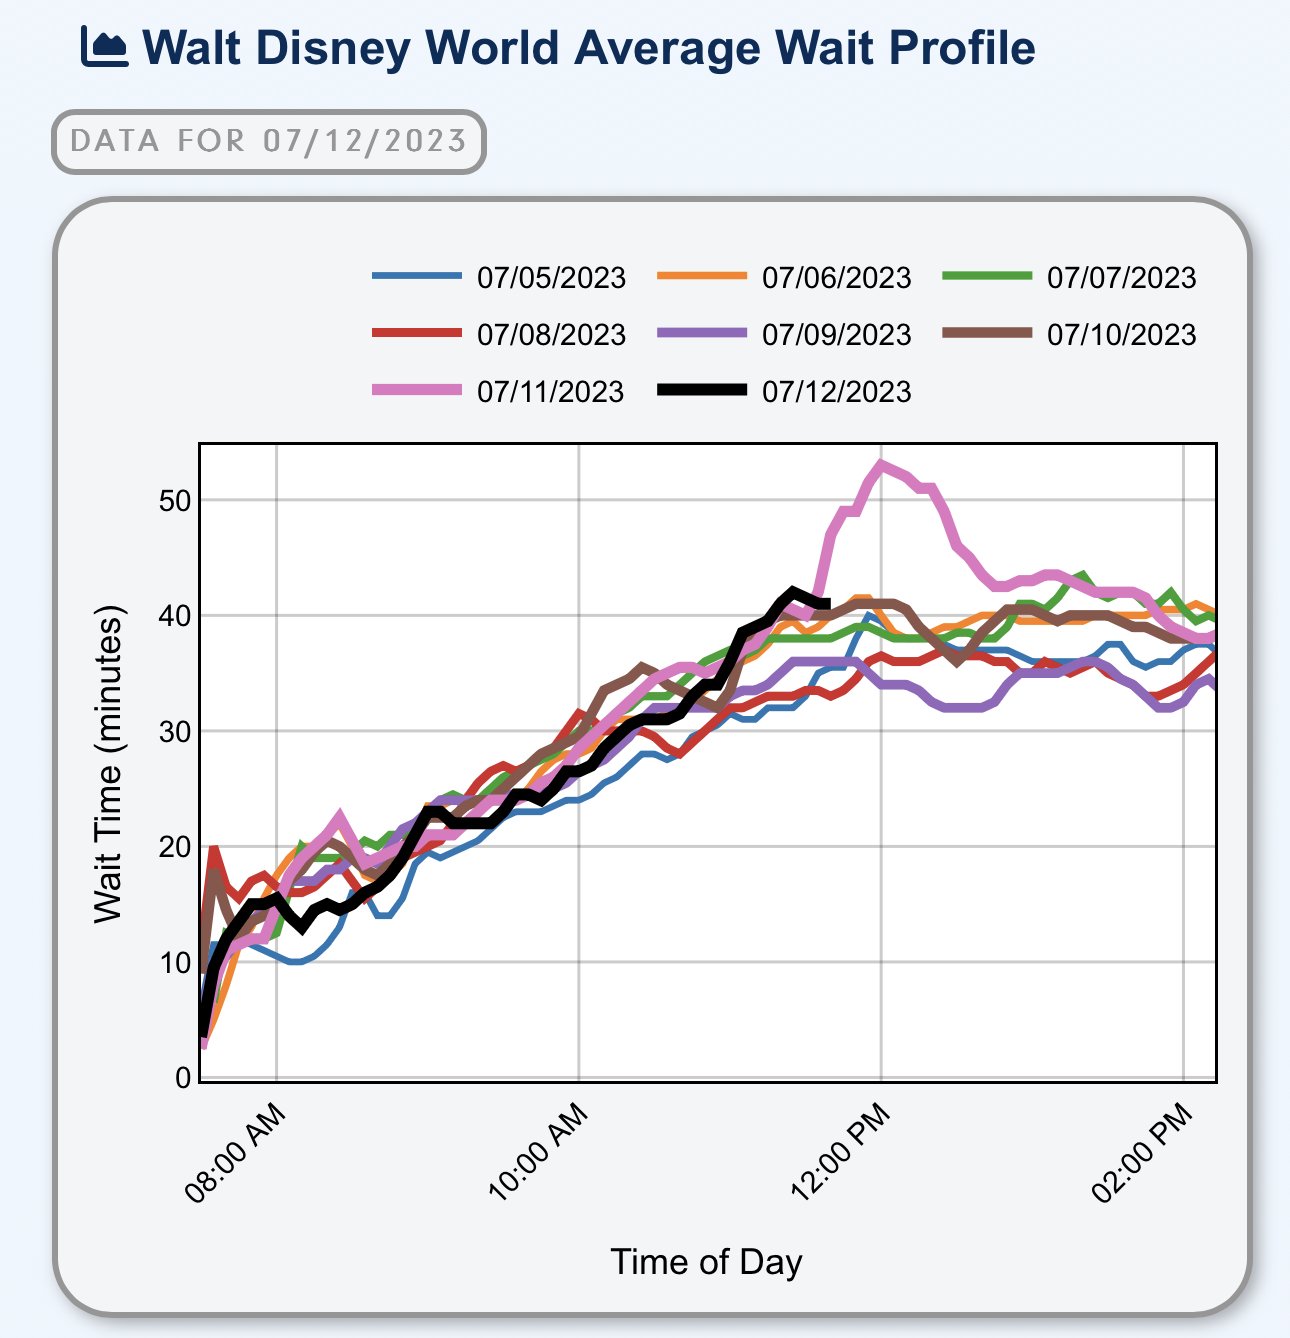
Disney World wait times are trending similar to yesterday. Don’t expect a big spike though unless it rains. https://www.thrill-data.com/waits/chain/wdw/
-
Each person attempting to obtain a boarding group would need to have tapped into the park already. They could leave after that though until it is time for the group to be called.
-
Universal Orlando Wait Times: '19, '21, '22, '23
Webmaster replied to Webmaster's topic in Wait Time Discussions
2021 wait times were pretty inflated at Universal Studios due to reduced capacity on attractions like Shrek 4D. -
These are the wait time averages for each Universal Orlando theme park January 1st to July 10th going back to 2019. 2020 is excluded on purpose due to COVID. Islands of Adventure 2019: blue 2021: red 2022: green 2023: purple Universal Studios Florida 2019: blue 2021: red 2022: green 2023: purple
-
The average wait times at Cedar Point today
-
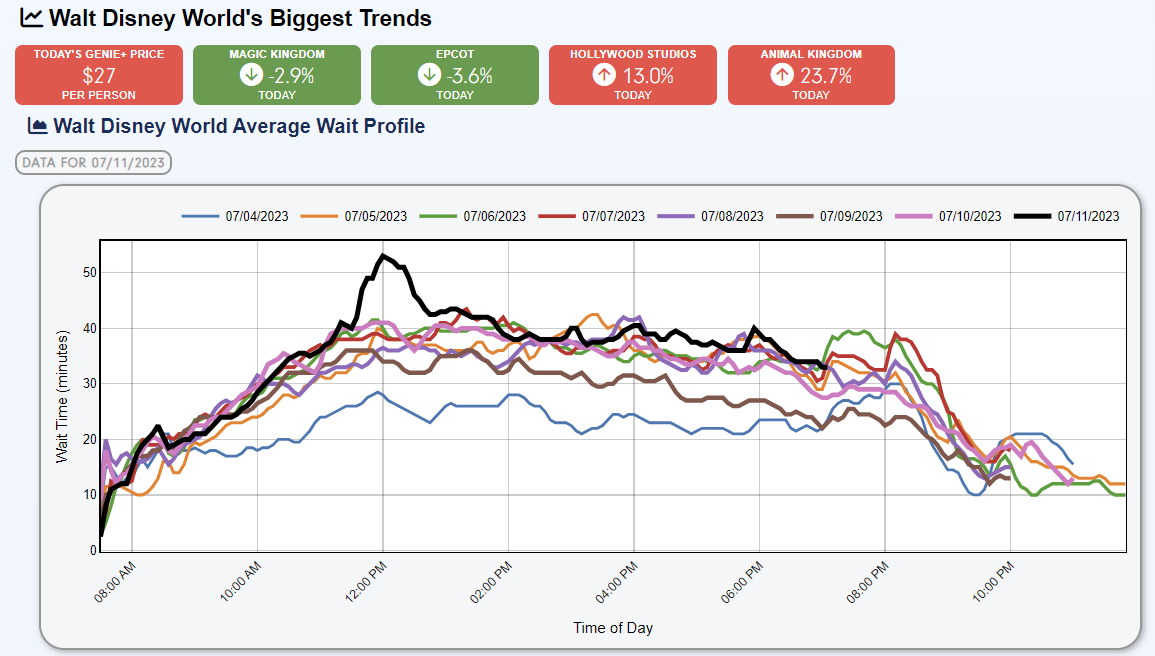
Wait times were up at 2 Disney Parks today and down at 2 others
-
Currently or has been raining today in Orlando, leading to higher wait times for indoor attractions.
-
These are the wait time averages for each Disney World theme park January 1st to July 10th going back to 2019. 2020 is excluded on purpose due to COVID. Magic Kingdom 2019: blue 2021: red 2022: green 2023: purple Hollywood Studios 2019: blue 2021: red 2022: green 2023: purple EPCOT 2019: blue 2021: red 2022: green 2023: purple Animal Kingdom 2019: blue 2021: red 2022: green 2023: purple
-
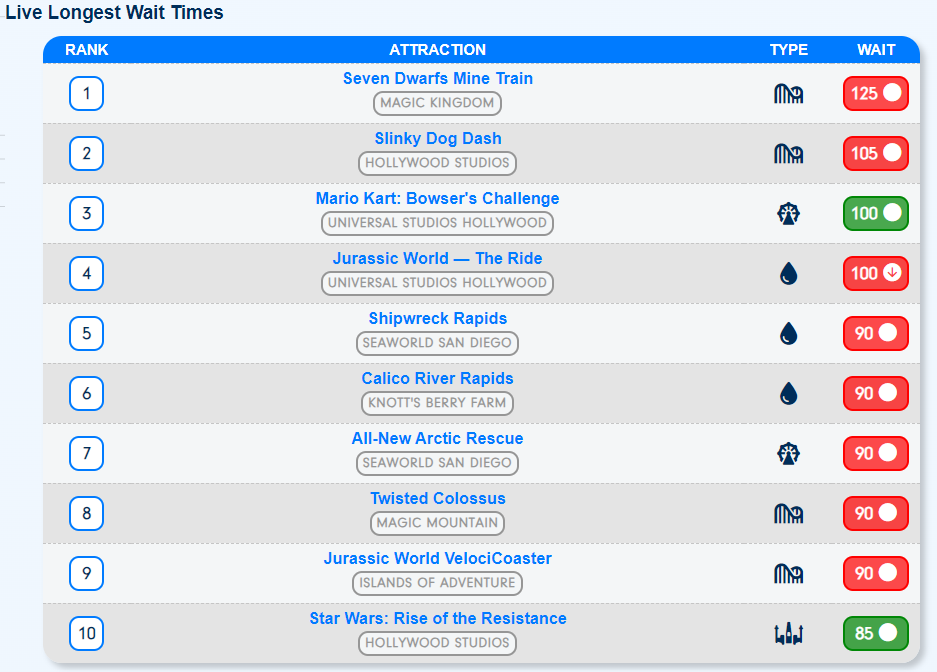
The current longest Sunday wait times
-

-
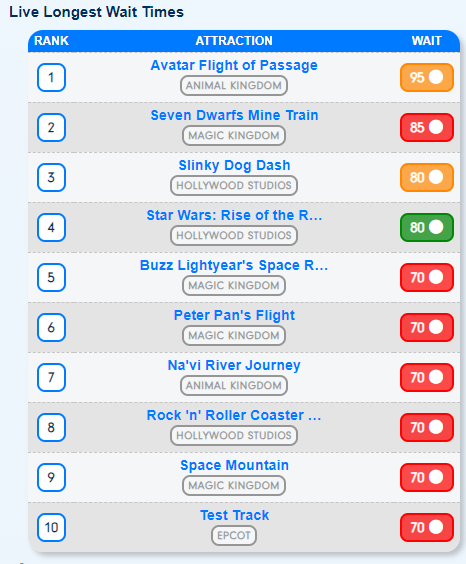
The current longest wait times at Disney World
-
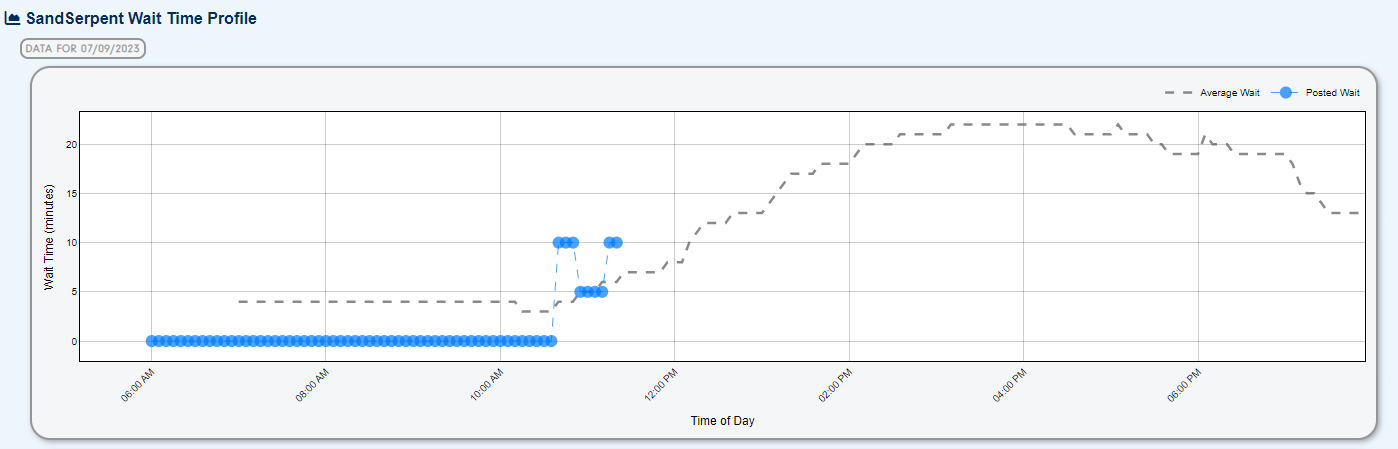
Today is the last day of operation for the SandSerpent (formerly Cheetah Chase) at Busch Gardens Tampa https://www.thrill-data.com/waits/attraction/busch-gardens-tampa/sandserpent/

.png.fc79b8e0eac47deada8ee0c6eda9a0c2.png)
.png.e06b7052fa2634474c6b1b46405f7710.png)
.png.d719edcef7e19c3c27cc7fe18cd80e2a.png)
.png.ca82a7a16a3a5b884ee203d574812641.png)
.png.767237b401e69ad8b4a4c02d65af1218.png)
.png.7227fac89a1b429dbae17165e1269199.png)
.png.6fbcb17bdefe33c160c7b1f8dbdbf59a.png)
.png.97c7340a1cbeff592de8ebaab4665999.png)
.png.d5f9b8e00594f9b481842ba02a3bff15.png)
.png.7a32f35cfd8d5cbca481b3869e9a3ea5.png)
.png.d9201d747431820a559d9efc48a72538.png)