Another Slow Disney World Holiday Weekend?

Entry posted by Webmaster in Data Analysis
2,480 views
It was well publicized in the national media that the Fourth of July weekend at Walt Disney World this year was particularly slow. A large contributor to this was block outs for the $89 per day ticket deals and Passholders. This same scenario occurred over the past Labor Day weekend holiday. So were wait times low across Walt Disney World again on the latest holiday weekend?
First, a comparison for each Disney World theme park between the 4th of July weekend, Labor Day weekend, a non-holiday last weekend of August (a recent week for comparison), and the average wait time profile for the past year plus. The weekend averages include the wait times from Saturday through Monday (it does include Tuesday, the 4th for July).
At all but the Magic Kingdom (likely due to Halloween Party on Labor Day itself), wait times on Labor Day weekend were at least 2% higher than the 4th of July weekend. EPCOT wait times were up 16% over that weekend. At all but EPCOT, wait times were down over Labor Day weekend compared to the last weekend of August by 5 to 12%. Compared to the past year plus average wait time profile, wait times were down at each Disney World theme park 7 to 33% over Labor Day weekend 2023! Over the past two major US holidays, Disney World wait times have been well below average.
This, again like the 4th of July, shows the power of a better deal. Guests are choosing to visit on other weekends for less overall cost than on holidays with no deals, but lower crowds.
-
Animal Kingdom Date Range: 09/02/2023 to 09/04/2023 vs:
- Average Wait: Difference of -12.1 min / -31.4%
- Animal Kingdom Date Range: 07/01/2023 to 07/04/2023: Difference of 1.6 min / 6.2%
- Animal Kingdom Date Range: 08/26/2023 to 08/28/2023: Difference of -1.6 min / -5.8%
.png.d91d01bb2a280fe692a5a963208c8935.png)
-
EPCOT Date Range: 09/02/2023 to 09/04/2023 vs:
- Average Wait: Difference of -2.3 min / -7.6%
- EPCOT Date Range: 07/01/2023 to 07/04/2023: Difference of 3.5 min / 16.0%
- EPCOT Date Range: 08/26/2023 to 08/28/2023: Difference of 3.3 min / 14.6%
.png.16fa644079f2d95e66c8f391cea52fd3.png)
-
Hollywood Studios Date Range: 09/02/2023 to 09/04/2023 vs:
- Average Wait: Difference of -15.2 min / -33.2%
- Hollywood Studios Date Range: 07/01/2023 to 07/04/2023: Difference of 0.7 min / 2.4%
- Hollywood Studios Date Range: 08/26/2023 to 08/28/2023: Difference of -4.1 min / -12.2%
.png.124024caa1d4ca20e3a4f162d189c37b.png)
-
Magic Kingdom Date Range: 09/02/2023 to 09/04/2023 vs:
- Average Wait: Difference of -10.0 min / -32.0%
- Magic Kingdom Date Range: 07/01/2023 to 07/04/2023: Difference of -2.0 min / -9.2%
- Magic Kingdom Date Range: 08/26/2023 to 08/28/2023: Difference of -1.1 min / -5.0%
.png.6b41aea5a5d501cb37c15e76deafaa83.png)
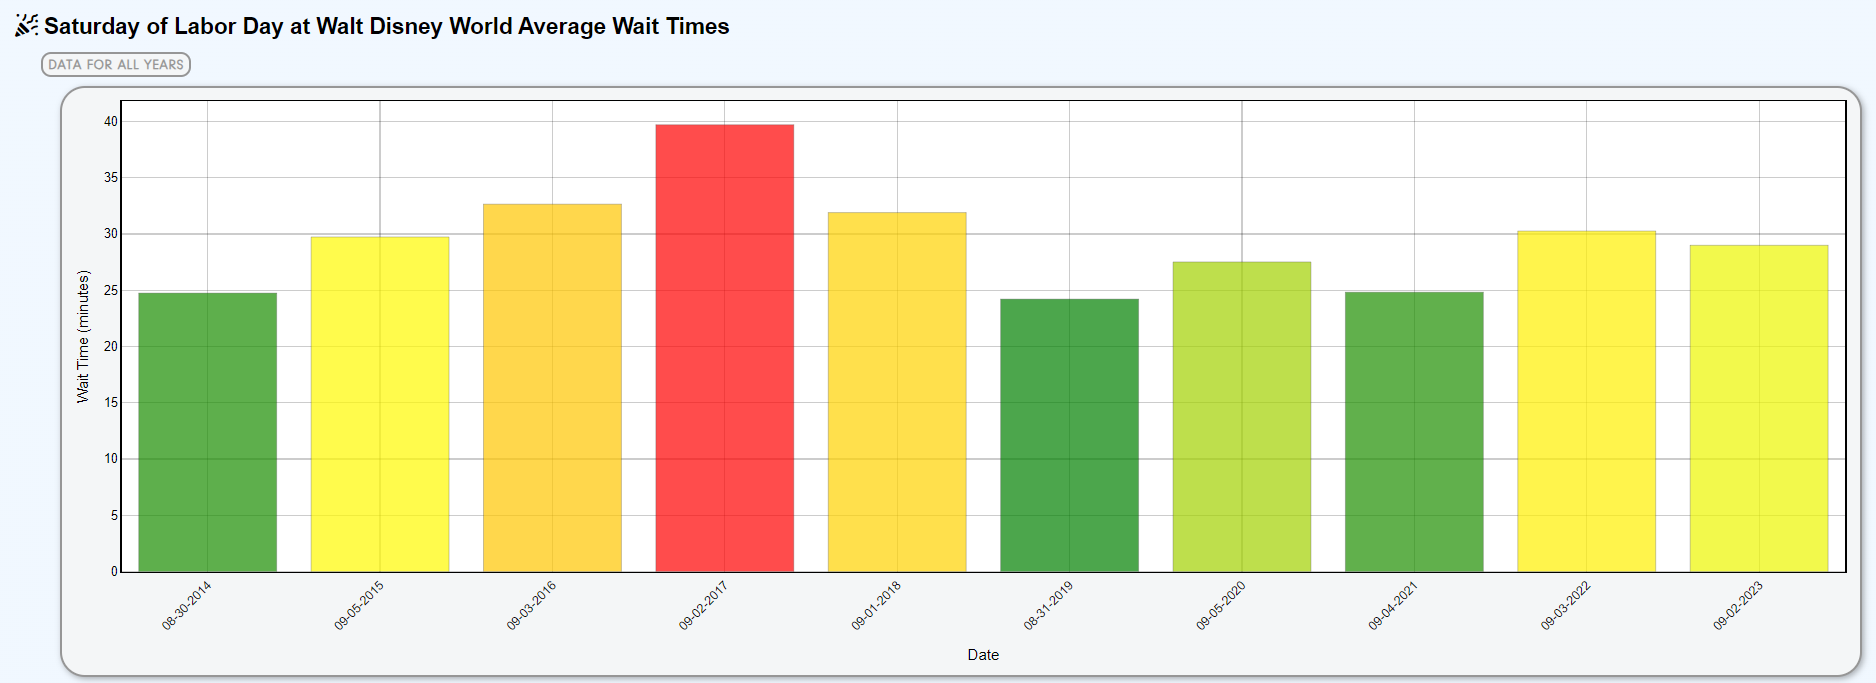
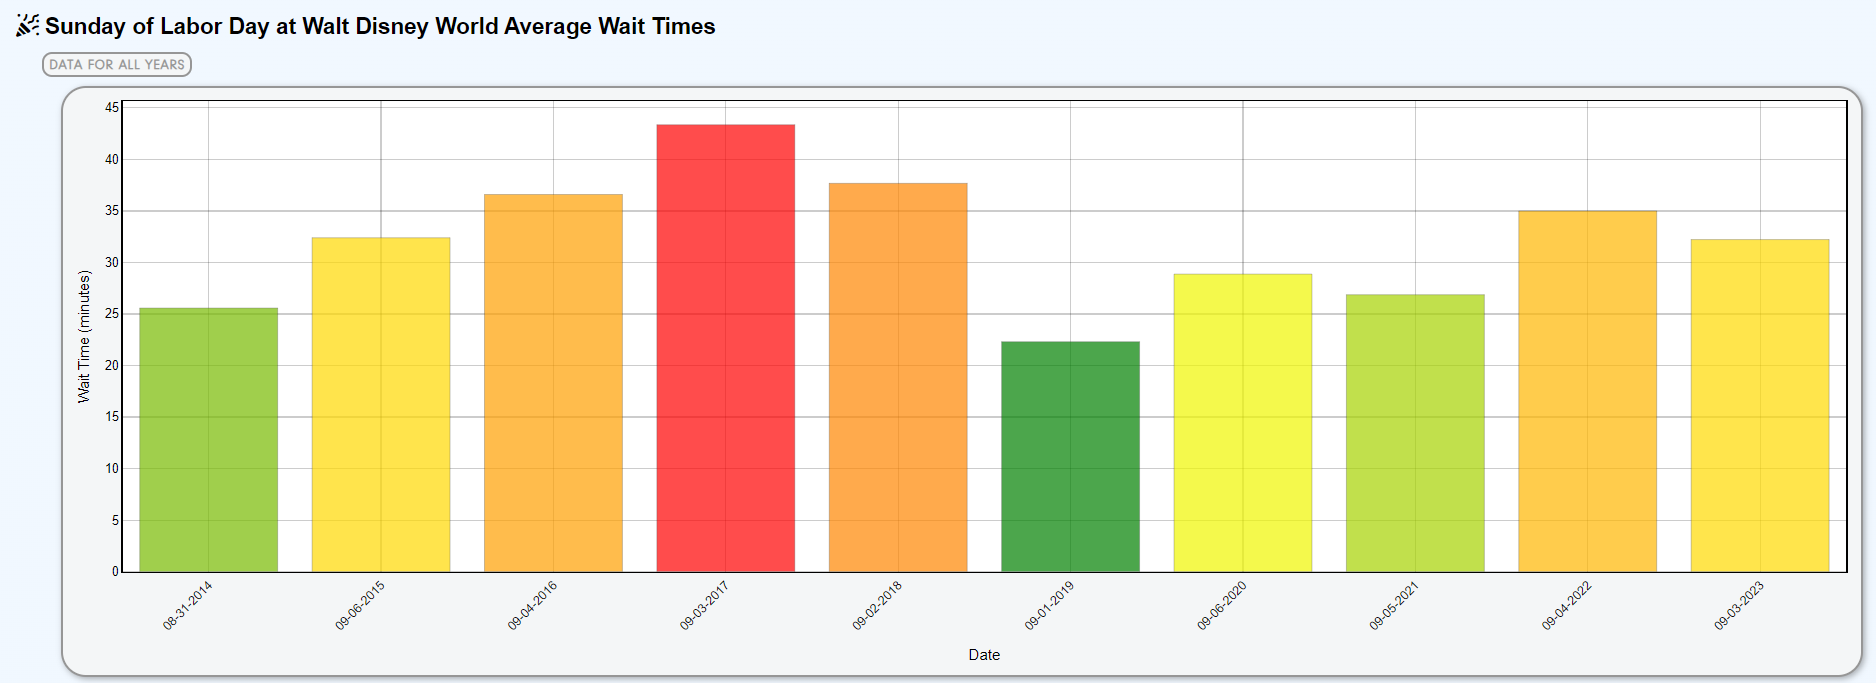
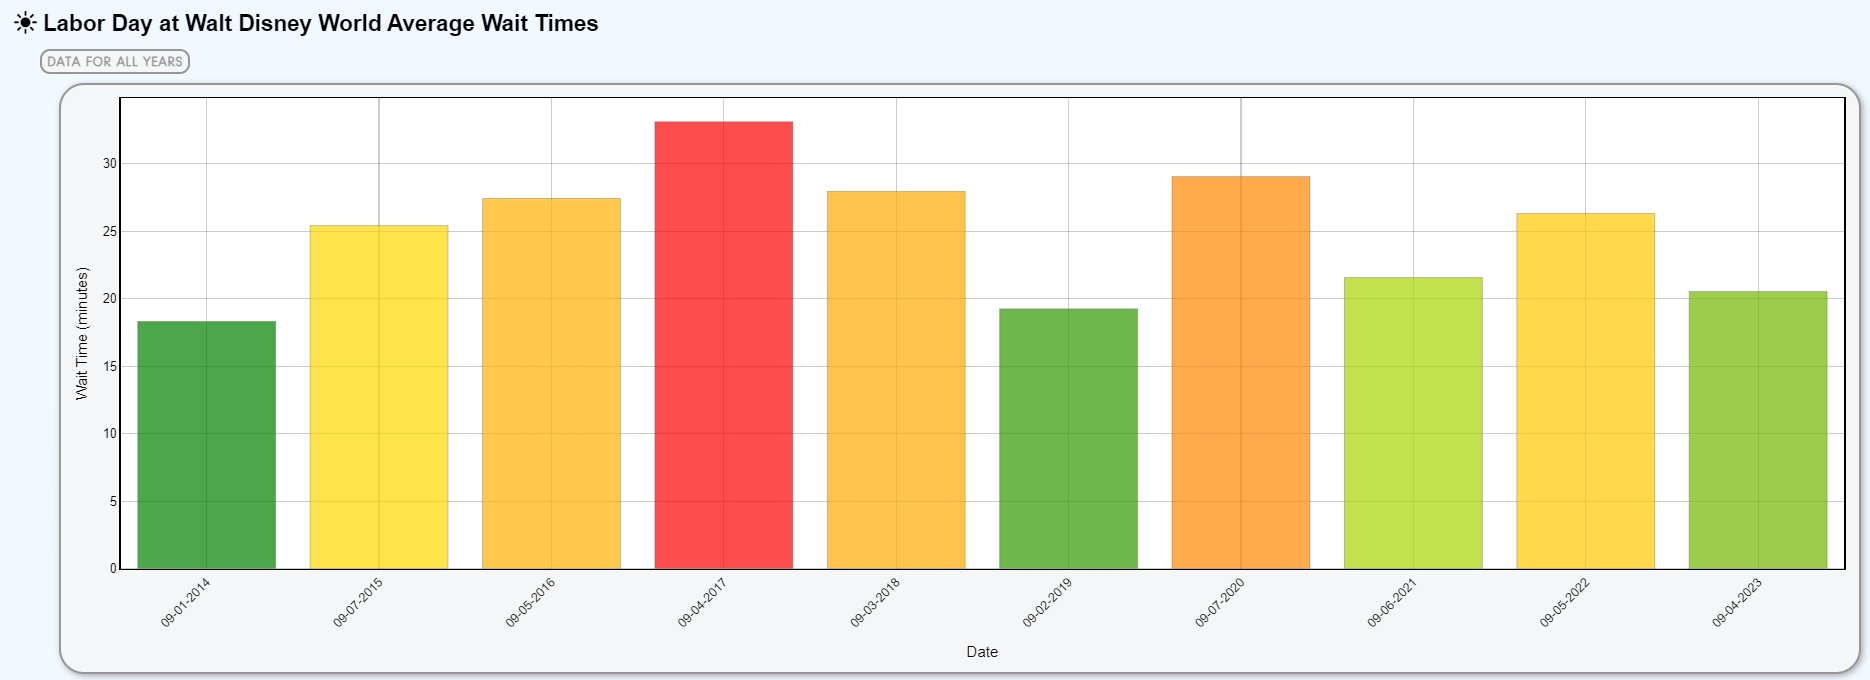
How did Labor Day weekend wait times compare to past years? Each day of this past weekend was slightly down from last year, except for a bigger drop on Labor Day Monday. Labor Day was also a Halloween Party on the Magic Kingdom last year, which does not explain that delta. Labor Day weekend at Disney World, in general, hasn't been as busy since the 2017/2018 time frame. 2020 data is hard to take to seriously as the socially distanced queues inflated wait times considerably.

0 Comments
Recommended Comments
There are no comments to display.
Create an account or sign in to comment
You need to be a member in order to leave a comment
Create an account
Sign up for a new account in our community. It's easy!
Register a new accountSign in
Already have an account? Sign in here.
Sign In Now