Disney World Half-Year Analysis 2024

Entry posted by Webmaster in Data Analysis
7,020 views
Six months down, and six more to go in 2024: we are officially half-way through the year! How do wait times across Walt Disney World Resort compare to previous years up to this point? We dive into the data to find out!
Resort wide, the pinnacle of post-pandemic travel was in winter and spring of 2022. Demand was very high coming out of a couple vacationless years for many (often referred to as the "revenge travel" period). January has had higher wait times the past two years than 2022 and before the pandemic in 2019. Spring break season in March is down quite a bit the past couple years as well, and June of this year saw more mild wait times than in the past.

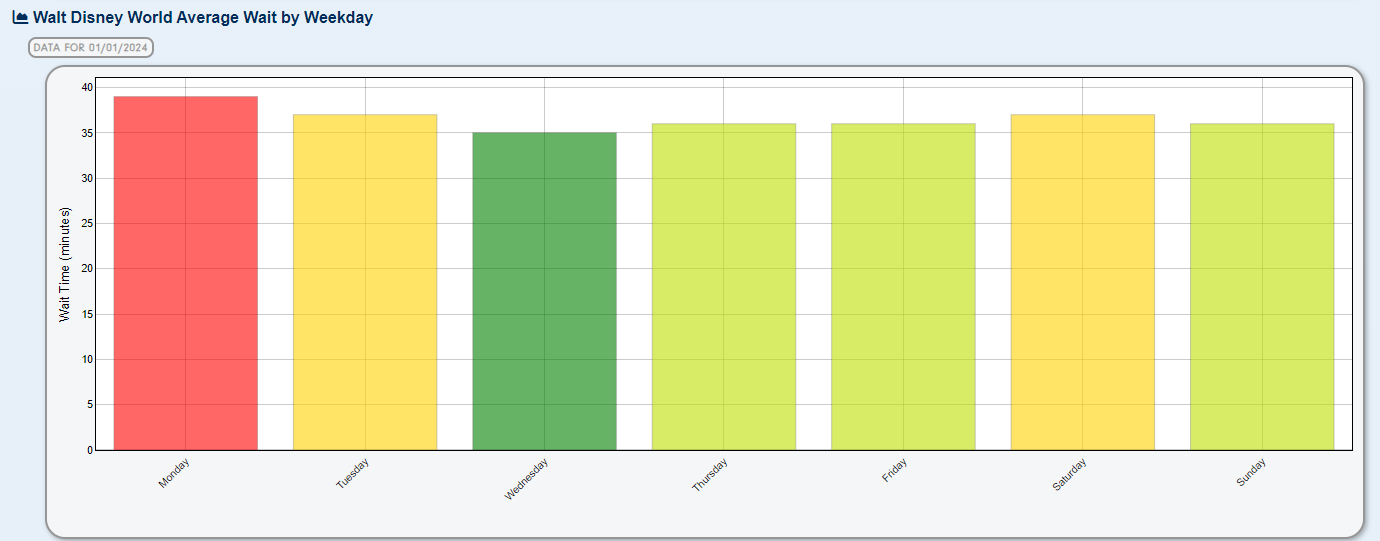
Across the resort, wait times, on average, have been their lowest on Wednesdays through the first half of the year at an average wait time of 35 minutes with Mondays having the highest average wait time of 39 minutes. This does vary park-to-park, which is detailed further down the article.
.png.a8d0c1ef221ff03156fdcb9f02c18a4a.png)
01/01/2019 to 06/30/2019 | 01/01/2022 to 06/30/2022 | 01/01/2023 to 06/30/2023 | 01/01/2024 to 06/30/2024
At the Magic Kingdom, average wait times for the first half of 2024 trended below each of the other years in the analysis by as much as 23%. Keep in mind that TRON Lightcycle / Run does not contribute to the average since it is Virtual Queue only (same for Tiana's Bayou Adventure, but that just opened June 28th). Even in the busy 2022, pre-pandemic wait time levels were not observed, partly due to the reservations system.
-
Magic Kingdom Date Range: 01/01/2024 to 06/30/2024 vs:
- Magic Kingdom Date Range: 01/01/2019 to 06/30/2019: Difference of -8.0 min / -23.4%
- Magic Kingdom Date Range: 01/01/2022 to 06/30/2022: Difference of -7.6 min / -22.0%
- Magic Kingdom Date Range: 01/01/2023 to 06/30/2023: Difference of -2.4 min / -8.4%
So far in 2024, Tuesdays and Wednesdays are leading the way in terms of highest average wait time at the Magic Kingdom. Weekends have been the days to visit to see lower wait times.

The busiest individual days at the Magic Kingdom in the first half of the aligned primarily with holiday periods and with different spring break weeks for areas across the US. The first week of January was busier than some years thanks to how the holiday period setup in December of 2023, leading to more breaks being extended into 2024 (including the local Orange County).


Most months through June 2024, Seven Dwarfs Mine Train averaged the highest wait time across the Magic Kingdom. March wait times averages, with the highest average of the first half, is shown below. Peter Pan's Flight, Jungle Cruise, and Space Mountain typically were the other highest wait times, on average.

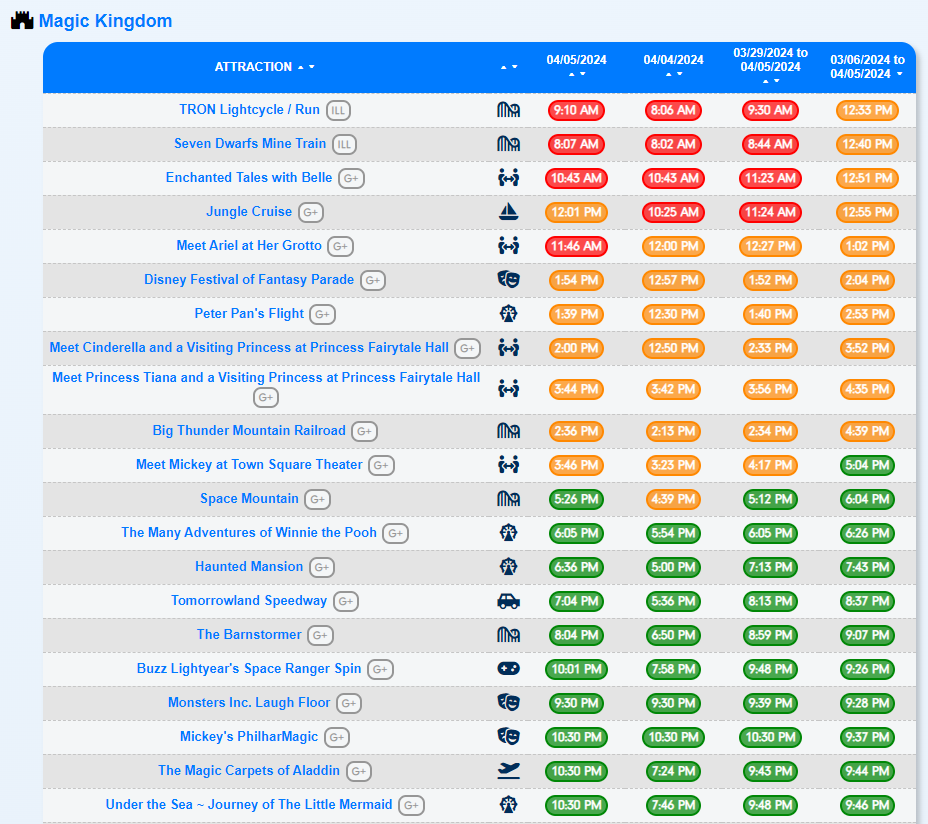
During the peak spring break season, Lightning Lane availability across the Magic Kingdom was decent. The table below is sorted based on the monthly average time at which Lightning Lane reached capacity. Earlier in the day is considered worse from a guest perspective, and is indicated in red or orange. Green means that the Lightning Lane for an attraction could still be obtained late in the afternoon. The two Individual Lightning Lane attractions, Seven Dwarfs Mine Train and TRON Lightcycle / Run, reached capacity first, on average. This data is useful to help set priorities during busy periods, but will change with the introduction of Lightning Lane Multiple Pass on July 24th. Also, since debuting at the end of June, Tiana's Bayou Adventure is now the first to reach capacity.
.png.67ffe0607c974140a5ecba3cc9057596.png)
01/01/2019 to 06/30/2019 | 01/01/2022 to 06/30/2022 | 01/01/2023 to 06/30/2023 | 01/01/2024 to 06/30/2024
Through six months, average wait times across Disney's Animal Kingdom were just about flat with 2023, but lower than 2022 and 2019. Before the pandemic, Avatar Flight of Passage was newer and often averaged a 2 hour wait time (or often much more), leading to a higher park average overall.
-
Animal Kingdom Date Range: 01/01/2024 to 06/30/2024 vs:
- Animal Kingdom Date Range: 01/01/2019 to 06/30/2019: Difference of -11.6 min / -24.2%
- Animal Kingdom Date Range: 01/01/2022 to 06/30/2022: Difference of -2.7 min / -6.8%
- Animal Kingdom Date Range: 01/01/2023 to 06/30/2023: Difference of -0.3 min / -0.8%
If you are looking for the best day to visit Disney's Animal Kingdom, through the first half of 2024, Wednesday are your best bet. Mondays, Fridays, and Saturdays tend to have higher average wait times.

February featured wait times on the higher end for Animal Kingdom. President's Day weekend and the winter break that follows is typically busy, but overall averages were high for most of the month. The winter is one of the few months in which you can see Pandora in all of its nighttime glory too.

In terms of Lightning Lane availability, during the busy spring break season, Avatar Flight of Passage typically reached capacity first followed by meeting Mickey and Minnie. The good news, if you miss the initial distribution for Flight of Passage, is that it typically replenishes several times a day.

.png.cab21c29237a14c1d92cd516653960a9.png)
01/01/2019 to 06/30/2019 | 01/01/2022 to 06/30/2022 | 01/01/2023 to 06/30/2023 | 01/01/2024 to 06/30/2024
Average wait times across Disney's Hollywood Studios were higher than before the pandemic by about 6% for the first half of the year. But they were nearly 20% lower than the peaks seen during 2022.
-
Hollywood Studios Date Range: 01/01/2024 to 06/30/2024 vs:
- Hollywood Studios Date Range: 01/01/2019 to 06/30/2019: Difference of 2.4 min / 6.4%
- Hollywood Studios Date Range: 01/01/2022 to 06/30/2022: Difference of -9.5 min / -19.2%
- Hollywood Studios Date Range: 01/01/2023 to 06/30/2023: Difference of -3.0 min / -7.0%
Disney's Hollywood Studios had three distinctly busier days in Mondays, Thursdays, and Fridays during the first six months of 2024, with lighter days on Sundays and Wednesdays.

During the peak spring break season, the highest wait times, on average, across Hollywood Studios were for Slinky Dog Dash and Star Wars: Rise of the Resistance, averaging wait times close to two hours. Smuggler's Run, Tower of Terror, and Runaway Railway also averaged over an hour wait.

Disney's Hollywood Studios is home to one of the most difficult Lightning Lanes to obtain: Slinky Dog Dash. During busy periods, such as the spring break season of 2024, it typically reaches capacity within a few minutes. It should be your #1 priority if you hope to obtain a Lightning Lane. The Individual Lightning Lane for Rise of the Resistance is generally also a hot commodity, often reaching capacity in the morning hours.

.png.db5395df7554970af62ee1f4ff54204b.png)
01/01/2019 to 06/30/2019 | 01/01/2022 to 06/30/2022 | 01/01/2023 to 06/30/2023 | 01/01/2024 to 06/30/2024
With its newer attractions, recent updates, and festivals, EPCOT has seen a growth in its average wait times in 2024 of at least 4.5% compared to 2019, 2022, and 2023. In particular, Guardians of the Galaxy: Cosmic Rewind (whose Virtual Queue typically fills in seconds still) and Remy's Ratatouille Adventure remain incredibly popular attractions across the entire resort.
-
EPCOT Date Range: 01/01/2024 to 06/30/2024 vs:
- EPCOT Date Range: 01/01/2019 to 06/30/2019: Difference of 4.5 min / 15.4%
- EPCOT Date Range: 01/01/2022 to 06/30/2022: Difference of 1.5 min / 4.6%
- EPCOT Date Range: 01/01/2023 to 06/30/2023: Difference of 2.4 min / 7.8%
EPCOT tended to be busiest on Mondays, but, unlike the other WDW parks, is pretty popular still on Saturdays and Sundays. Locals often visiting on the weekend to partake in the festivals being offered.

Wait time wise, during busy periods in the first half of the year, Frozen Ever After and Remy's Ratatouille Adventure drew the biggest crowds with average wait times over 80 minutes. Guardians of the Galaxy: Cosmic Rewind utilizes the Virtual Queue, but once a boarding group is redeemed, wait times do often exceed an hour or more.

In terms of Lightning Lane, EPCOT has a "big three" attractions that are a part of Genie+/Lightning Lane Multi Pass that are high in demand: Remy's Ratatouille Adventure, Frozen Ever After, and Test Track. It is often very difficult to obtain two or three of these attractions. The good news is that is a somewhat consistent pattern to additional availability for these. Cosmic Rewind, as an Individual Lightning Lane, often is too, especially during holiday periods. Note that Test Track is now closed for refurbishment.

Overall, wait times were a bit lower across Walt Disney World through the first half of 2024 than the past couple years. EPCOT is the one exception where average wait times are up. Big changes are on the way with Lightning Lane Multi Pass and Single Pass allowing pre-trip selections. It will interesting to see how those changes affect the data for the rest of the year!
-
 1
1

1 Comment
Recommended Comments
Create an account or sign in to comment
You need to be a member in order to leave a comment
Create an account
Sign up for a new account in our community. It's easy!
Register a new accountSign in
Already have an account? Sign in here.
Sign In Now