Webmaster
-
Posts
1,486 -
Joined
-
Last visited
-
Days Won
25
Content Type
Profiles
Forums
Gallery
Events
How-To
Blogs
Everything posted by Webmaster
-
Downloaded the game today!
-

Danse Macabre wait time data for Efteling
Webmaster replied to TheTalbotHound's topic in Support & How-To
Here it is:https://www.thrill-data.com/waits/attraction/efteling/dansemacabre/ -
We only allow for the current and past year to be downloaded. The Port Aventura API hasn't been particularly reliable and has been out for several months now as well.
-
Danse Macabre wait time data for Efteling
Webmaster replied to TheTalbotHound's topic in Support & How-To
Let me run the update script and then it should appear. -
As is currently, the calendars are based on what wait times have been in the past. So there can be differences based on when things are scheduled throughout the year. From what I have seen, dance/cheer competitions don't move the needle on wait times a bunch.
-
Difference between median and average wait
Webmaster replied to orlandoeconomico's topic in Support & How-To
The average is the sum of all numbers divided by the total number of numbers. The median is the middle number if all of the numbers are ordered from smallest to largest. -
Data collection should be working again now.
-
How to download waiting time data for individual rides?
Webmaster replied to chowzgoyk's topic in Support & How-To
You can go to each ride and find a download option: Battlestar Galactica: CYLON Wait Times at Universal Studios Singapore | Thrill Data (thrill-data.com) -
About Lightning Lane Sell Out Data
Webmaster replied to orlandoeconomico's topic in Lightning Lane Questions & Discussion/VQ
That's correct -
One-third of September has already come and gone across Walt Disney World. September typically has the lowest average wait time across the resort, and the data so far in 2024 has continued that trend. Primary reason why? School is back across the United States. Below, the weekly average wait time for Walt Disney World for each week in 2024 is graphed. The past two weeks and the current week are the lowest that have been seen yet. How do the wait time at each theme park compare to past years for the first one-third of September? Let's take a deeper look below. Disney's Animal Kingdom Compared to 2019 trough 2023 (with the COVID year of 2020 intentionally omitted), wait times at Disney's Animal Kingdom are up compared slightly to significantly to previous years for the first third of September. Graph Legend Animal Kingdom Date Range: 09/01/2019 to 09/11/2019 (solid) Animal Kingdom Date Range: 09/01/2021 to 09/11/2021 (solid) Animal Kingdom Date Range: 09/01/2022 to 09/11/2022 (solid) Animal Kingdom Date Range: 09/01/2023 to 09/11/2023 (solid) Animal Kingdom Date Range: 09/01/2024 to 09/11/2024 (solid) Animal Kingdom Date Range: 09/01/2024 to 09/11/2024 vs: Average Wait: Difference of -11.7 min / -30.6% Animal Kingdom Date Range: 09/01/2019 to 09/11/2019: Difference of 5.5 min / 26.0% Animal Kingdom Date Range: 09/01/2021 to 09/11/2021: Difference of 10.6 min / 62.8% Animal Kingdom Date Range: 09/01/2022 to 09/11/2022: Difference of 2.0 min / 8.2% Animal Kingdom Date Range: 09/01/2023 to 09/11/2023: Difference of 0.1 min / 0.4% EPCOT Compared to 2019 trough 2023 (with the COVID year of 2020 intentionally omitted), wait times at EPCOT are up compared to 2019, 2021, and 2022, but down 14% from the first third of last September. Graph Legend EPCOT Date Range: 09/01/2019 to 09/11/2019 (solid) EPCOT Date Range: 09/01/2021 to 09/11/2021 (solid) EPCOT Date Range: 09/01/2022 to 09/11/2022 (solid) EPCOT Date Range: 09/01/2023 to 09/11/2023 (solid) EPCOT Date Range: 09/01/2024 to 09/11/2024 (solid) EPCOT Date Range: 09/01/2024 to 09/11/2024 vs: Average Wait: Difference of -9.1 min / -29.8% EPCOT Date Range: 09/01/2019 to 09/11/2019: Difference of 2.9 min / 16.8% EPCOT Date Range: 09/01/2021 to 09/11/2021: Difference of 6.1 min / 42.0% EPCOT Date Range: 09/01/2022 to 09/11/2022: Difference of 0.9 min / 4.8% EPCOT Date Range: 09/01/2023 to 09/11/2023: Difference of -3.3 min / -14.0% Disney's Hollywood Studios Compared to 2019 trough 2023 (with the COVID year of 2020 intentionally omitted), wait times at Disney's Hollywood Studios are up compared to 2019 and 2021, but down 14 to 20% compared to 2022 and 2023. Graph Legend Hollywood Studios Date Range: 09/01/2019 to 09/11/2019 (solid) Hollywood Studios Date Range: 09/01/2021 to 09/11/2021 (solid) Hollywood Studios Date Range: 09/01/2022 to 09/11/2022 (solid) Hollywood Studios Date Range: 09/01/2023 to 09/11/2023 (solid) Hollywood Studios Date Range: 09/01/2024 to 09/11/2024 (solid) Hollywood Studios Date Range: 09/01/2024 to 09/11/2024 vs: Average Wait: Difference of -16.9 min / -39.2% Hollywood Studios Date Range: 09/01/2019 to 09/11/2019: Difference of 3.6 min / 16.6% Hollywood Studios Date Range: 09/01/2021 to 09/11/2021: Difference of 3.1 min / 13.4% Hollywood Studios Date Range: 09/01/2022 to 09/11/2022: Difference of -7.0 min / -21.4% Hollywood Studios Date Range: 09/01/2023 to 09/11/2023: Difference of -4.3 min / -14.4% The Magic Kingdom Compared to 2019 trough 2023 (with the COVID year of 2020 intentionally omitted), wait times at the Magic Kingdom are up compared to 2019 and 2021, but down 11% or more compared first third of September in 2022 and 2023. Graph Legend Magic Kingdom Date Range: 09/01/2019 to 09/11/2019 (solid) Magic Kingdom Date Range: 09/01/2021 to 09/11/2021 (solid) Magic Kingdom Date Range: 09/01/2022 to 09/11/2022 (solid) Magic Kingdom Date Range: 09/01/2023 to 09/11/2023 (solid) Magic Kingdom Date Range: 09/01/2024 to 09/11/2024 (solid) Magic Kingdom Date Range: 09/01/2024 to 09/11/2024 vs: Average Wait: Difference of -11.2 min / -38.2% Magic Kingdom Date Range: 09/01/2019 to 09/11/2019: Difference of 0.7 min / 4.2% Magic Kingdom Date Range: 09/01/2021 to 09/11/2021: Difference of 1.2 min / 7.6% Magic Kingdom Date Range: 09/01/2022 to 09/11/2022: Difference of -5.1 min / -23.4% Magic Kingdom Date Range: 09/01/2023 to 09/11/2023: Difference of -2.1 min / -11.0% At the Magic Kingdom, early September wait times are down about 13% from August of this year, and 18% from July of this year. The Halloween Parties definitely play a factor when comparing September and August to July though. Magic Kingdom Date Range: 09/01/2024 to 09/11/2024 vs: Average Wait: Difference of -11.2 min / -38.2% Magic Kingdom Date Range: 07/01/2024 to 07/31/2024: Difference of -3.8 min / -18.4% Magic Kingdom Date Range: 08/01/2024 to 08/31/2024: Difference of -2.5 min / -13.0%
-
About Lightning Lane Sell Out Data
Webmaster replied to orlandoeconomico's topic in Lightning Lane Questions & Discussion/VQ
For the advanced availability, you want to look at this page: https://www.thrill-data.com/lightning-lane The sell out pages only applies to the current day as it happens. -
About Lightning Lane Sell Out Data
Webmaster replied to orlandoeconomico's topic in Lightning Lane Questions & Discussion/VQ
Same day sell outs are now calculated beginning at midnight after the availability disappears for the first time that day. For example, if Tiana does not have availability at 12:00 AM but it does appear at 4:00 AM, the counter now starts. If it has availability from 4:00 AM to 6:30 AM, the sell out time will now show 6:30 AM. -
21 Day Availability
Webmaster replied to wisblue's topic in Lightning Lane Questions & Discussion/VQ
Should be back to normal. Thanks for noticing! -
21 Day Availability
Webmaster replied to wisblue's topic in Lightning Lane Questions & Discussion/VQ
Taking a look at it -
Lightning Lane Data Post 7-24?
Webmaster replied to JimmyD's topic in Lightning Lane Questions & Discussion/VQ
I'm behind on it at the moment. Currently a manual process. On the TRON and GOG pages, there is a graph of the availability that does automatically update. -
August has come and gone at Walt Disney World, and Spooky Season has begun. Many schools have returned and most will in the next few days, leading to what is usually a quieter September. But remember that quieter does not mean dead; it means lower wait times, on average, than other parts of the year. Let's compare August 2024 wait times to other Augusts in recent years. Animal Kingdom August 2024 vs: Average Wait: Difference of -5.5 min / -14.6% August 2019: Difference of -11.0 min / -25.4% August 2020: Difference of 20.3 min / 156.4% August 2021: Difference of 10.7 min / 48.4% August 2022: Difference of -3.2 min / -9.2% August 2023: Difference of 0.3 min / 0.8% EPCOT August 2024 vs: Average Wait: Difference of -8.5 min / -27.8% August 2019: Difference of -2.0 min / -8.6% August 2020: Difference of 7.4 min / 49.6% August 2021: Difference of 6.3 min / 39.0% August 2022: Difference of -3.5 min / -14.0% August 2023: Difference of -3.7 min / -14.8% Hollywood Studios August 2024 vs: Average Wait: Difference of -11.4 min / -26.4% August 2019: Difference of -1.3 min / -4.0% August 2020: Difference of 9.0 min / 37.0% August 2021: Difference of 3.1 min / 10.4% August 2022: Difference of -7.1 min / -19.2% August 2023: Difference of -6.8 min / -17.6% The Magic Kingdom August 2024 vs: Average Wait: Difference of -8.0 min / -28.6% August 2019: Difference of -9.3 min / -33.0% August 2020: Difference of 5.8 min / 37.8% August 2021: Difference of -2.3 min / -10.8% August 2022: Difference of -7.1 min / -27.2% August 2023: Difference of -3.3 min / -15.0%
-
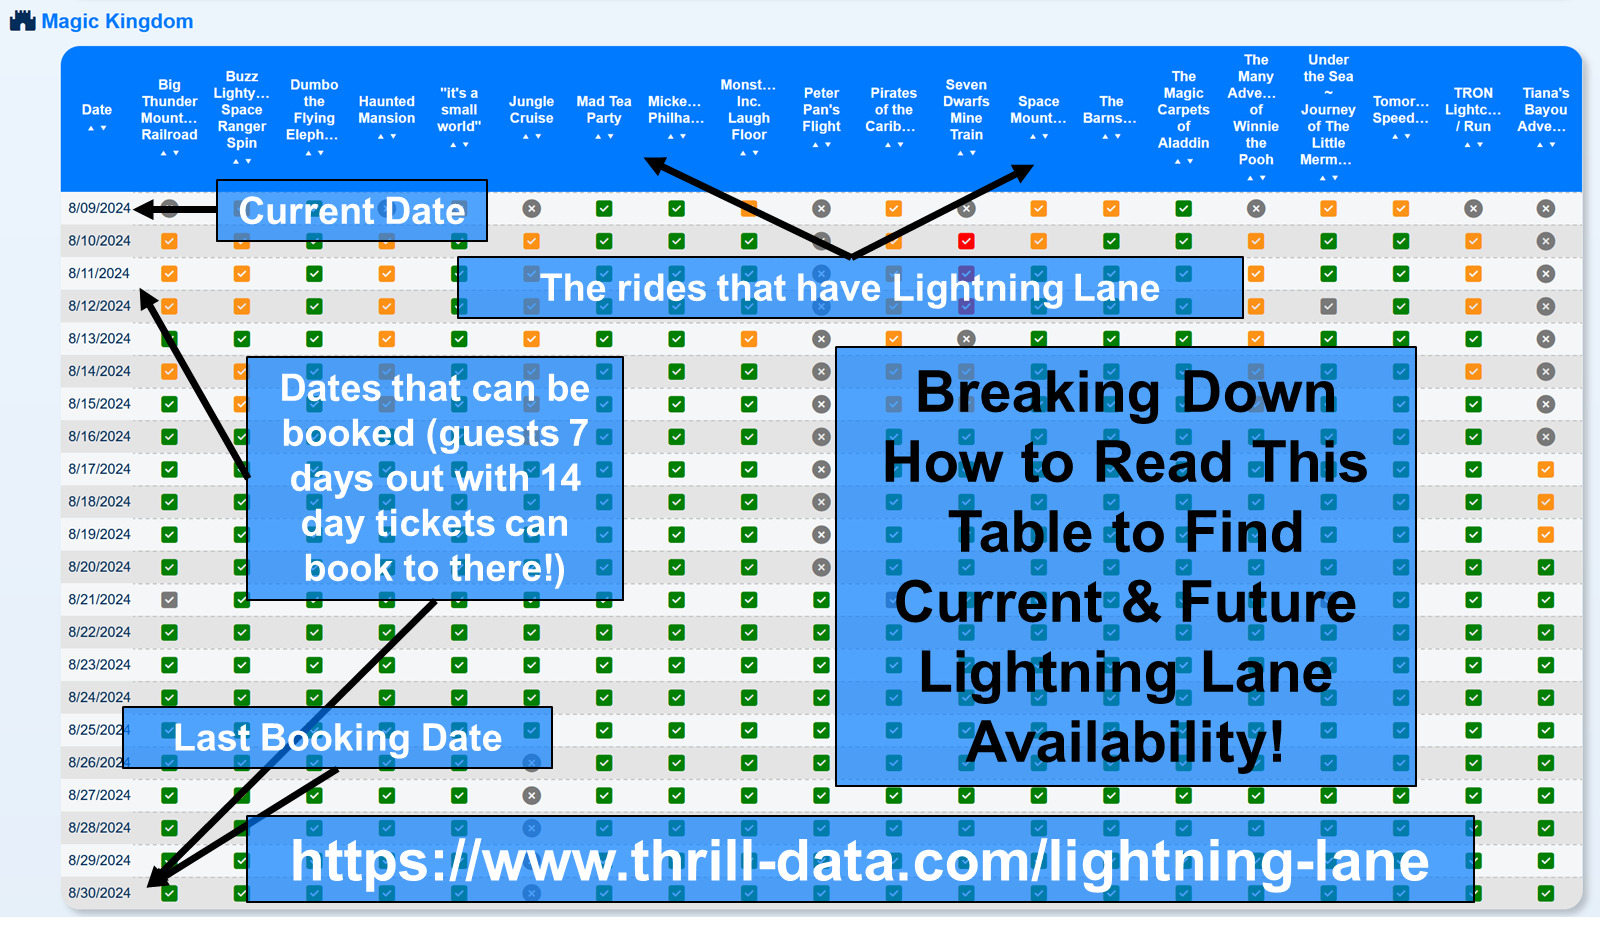
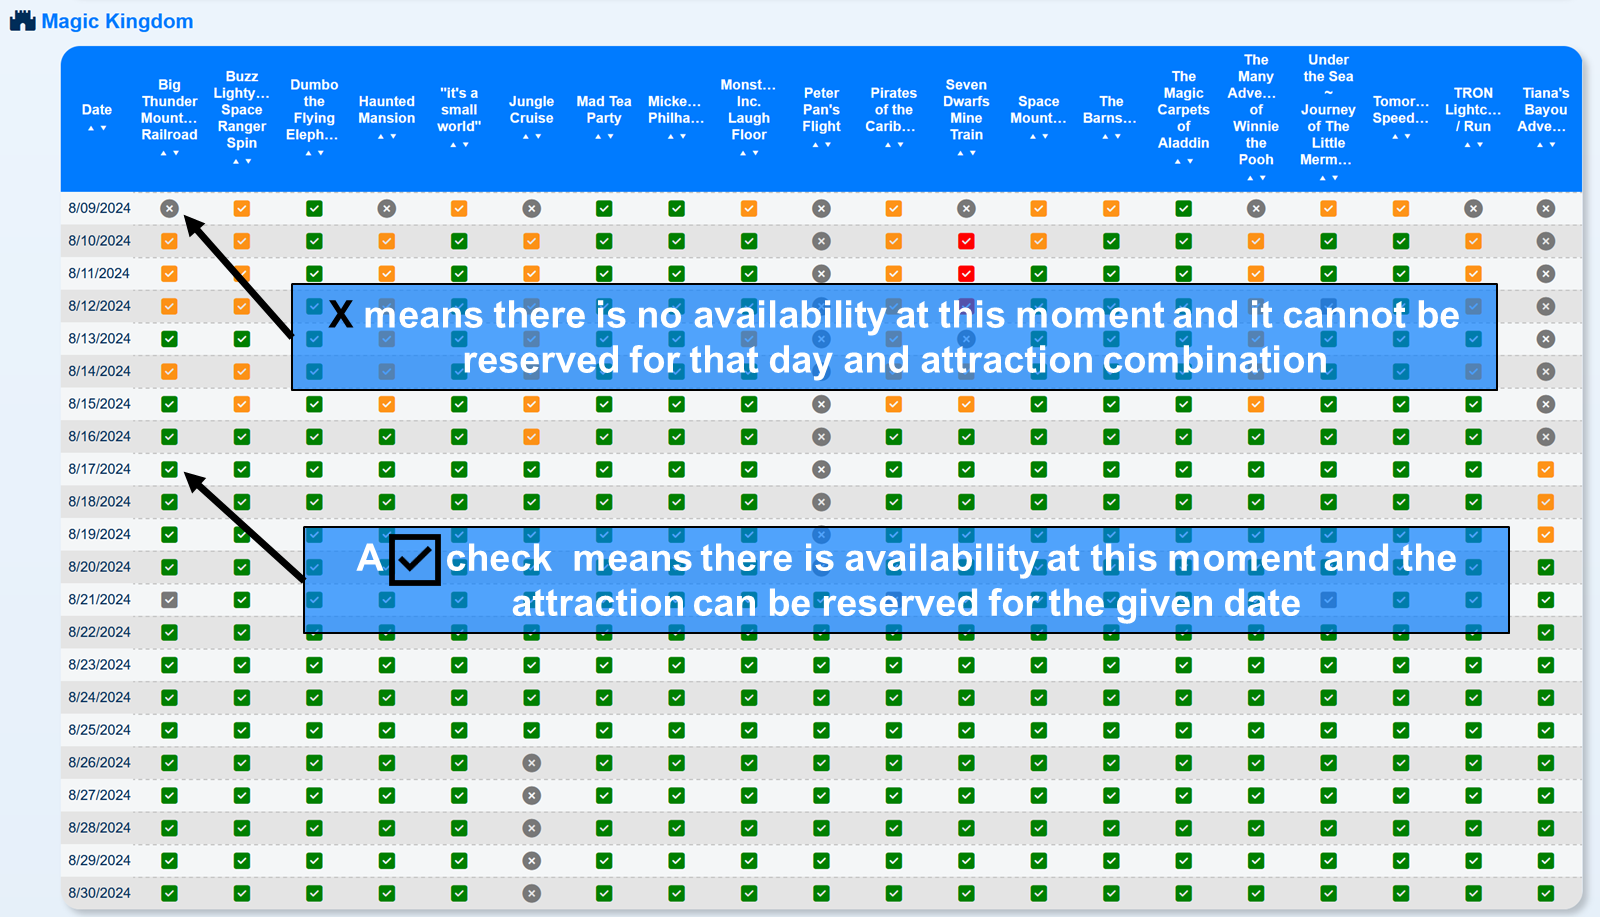
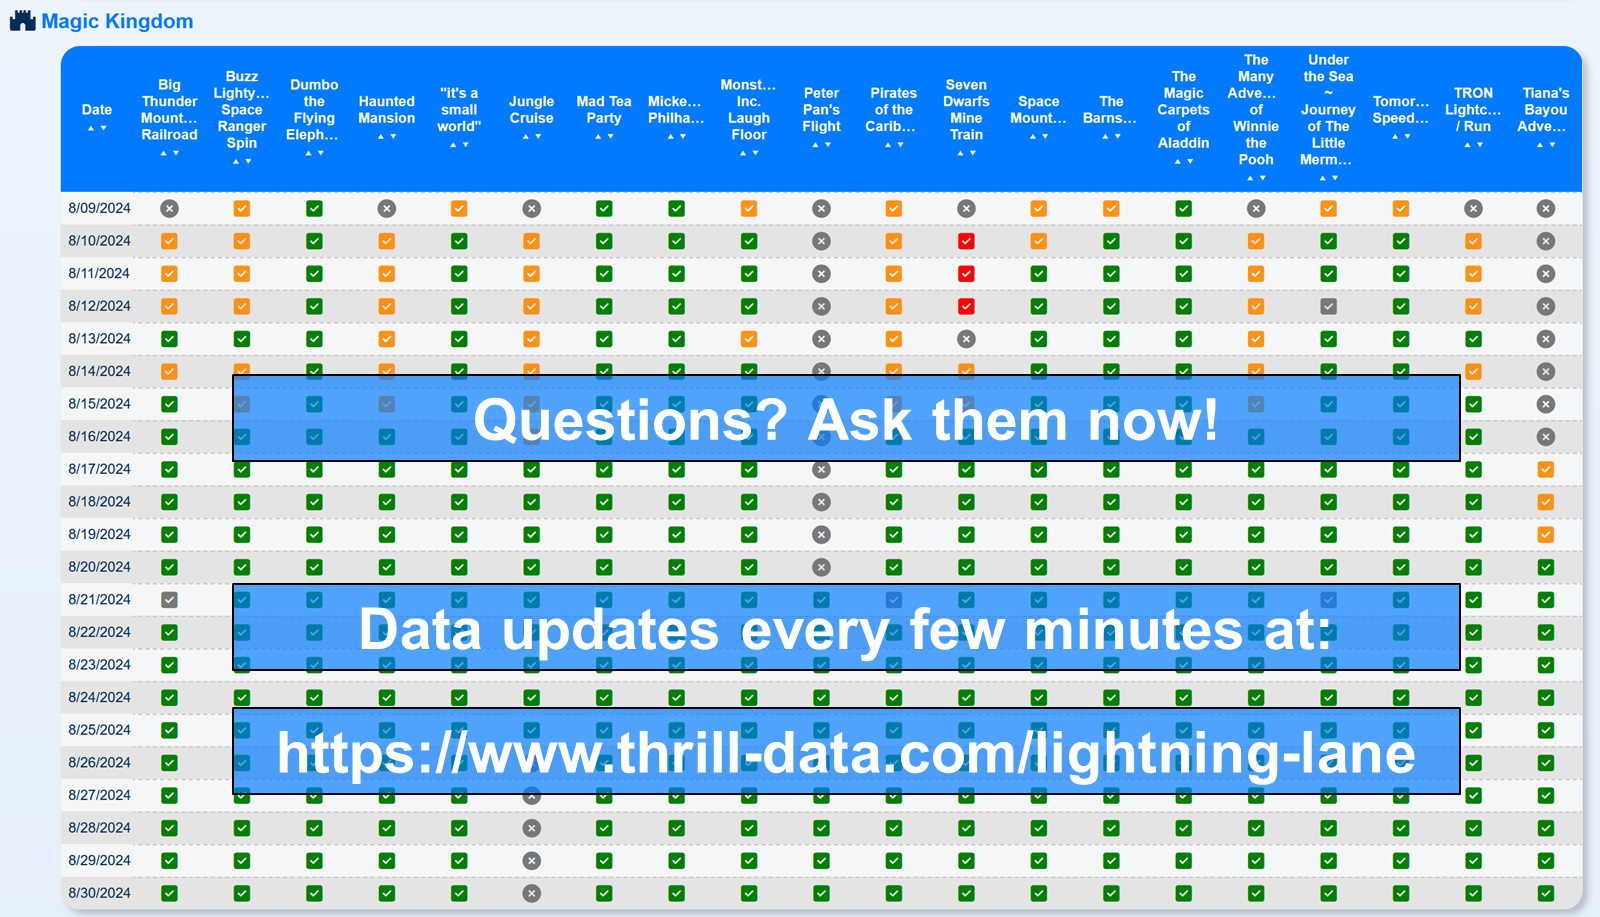
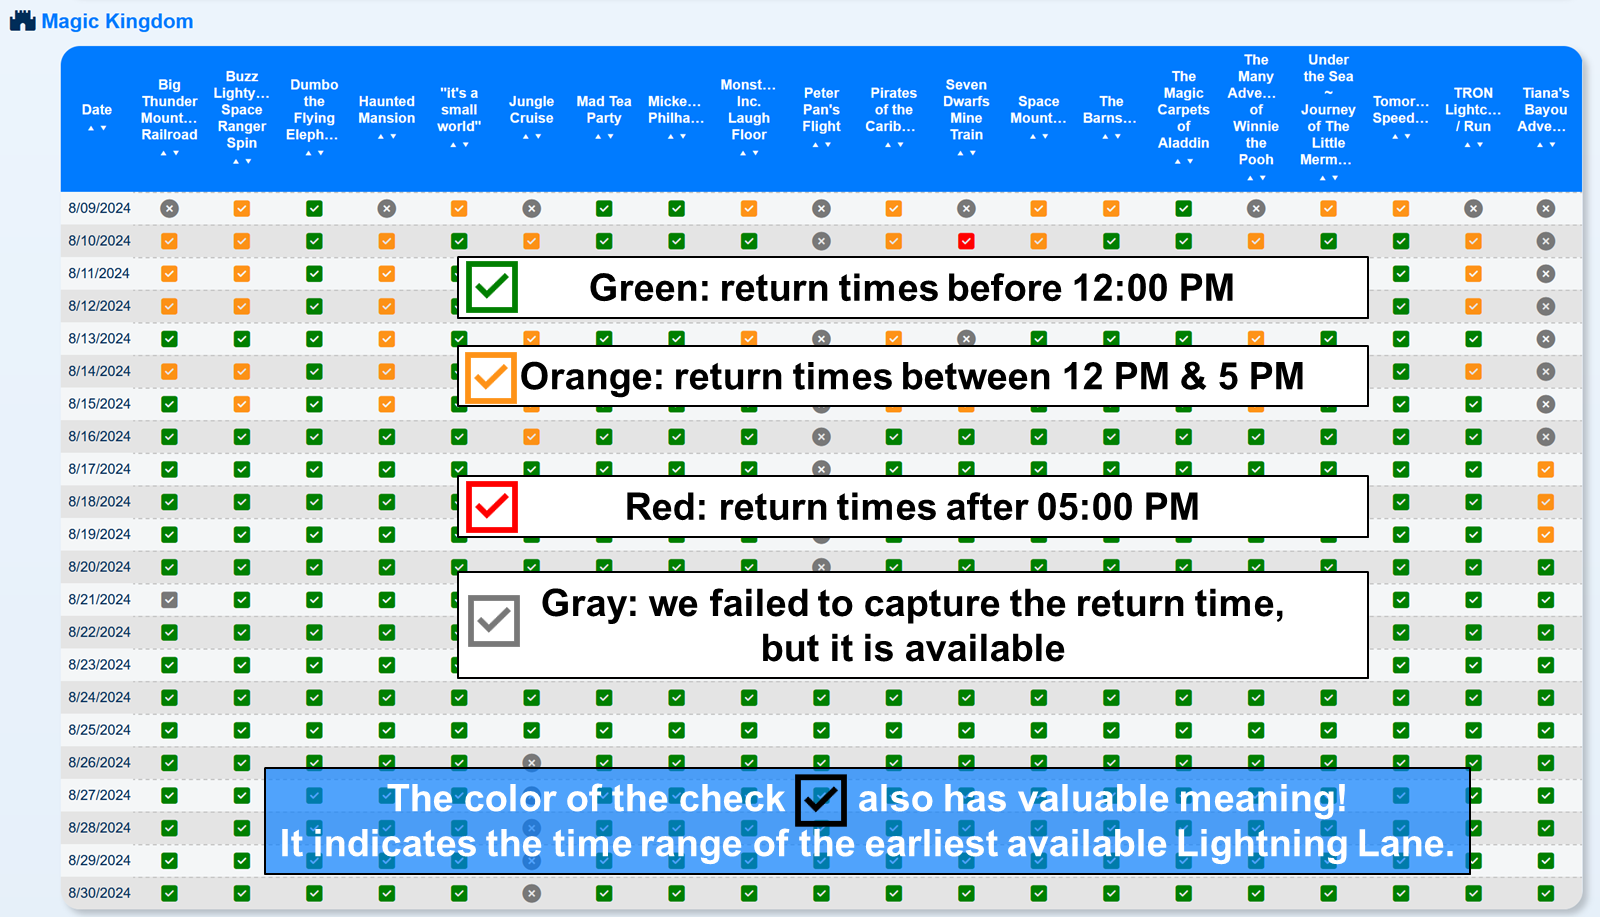
Our new Lightning Lane availability tables contain a bunch of information! To help out, we break down what information they contain in the images below: https://www.thrill-data.com/lightning-lane

-
It is early August... so Spooky Season has begun... at least at the Magic Kingdom within the Walt Disney World Resort. Beginning Friday, August 9th, Mickey's Not So Scary Halloween Party (MNSSHP) is back for 2024, running through Halloween. Typical party days are each Friday, Sunday, and Tuesday night, with a few other dates sprinkled in. An often asked question is how do the Halloween parties affect wait times across Walt Disney World? Lets take a look at some data from the past couple years to find out the impacts to the Magic Kingdom and the other three theme parks. When the Magic Kingdom hosts a MNSSHP event, which is a separately ticketed event, the park closes at 6 PM to regular ticket holders for the Magic Kingdom for that day (usual closing time is around 9 or 10 PM on a typical day). This, alone, seems like a big discouragement to visit the park as you do not get access to the fireworks and the park is open fewer hours. And the data supports that. In both 2022 and 2023, the daily average wait time for the Magic Kingdom, which only considers wait times from 10:00 AM to 5:00 PM (and not the party that features lower wait times), is over 30% lower (~11 minutes lower, on average) on a MNSSHP day than the non-party days that surround it. It is clear to see when this is depicted graphically, as shown below for 2022 and 2023. The party days, in the orange dots, show clear separation to the surrounding non-party days (blue dots). So if Magic Kingdom wait times are lower on a party day, are the other three theme parks busier? The same analysis was conducted for the other theme parks with their graphs for 2022 and 2023 below. Visually, you can notice that there is not as significant of a difference as with the Magic Kingdom, but what do the numbers says? EPCOT Disney's Hollywood Studios Disney's Animal Kingdom Across the board, by average, Mickey's Not So Scary Halloween Party days are busier at the other three theme parks by at least 4%. The difference at Disney's Animal Kingdom has been greater, with wait times increasing by 17%, or over 5 minutes, on party days. EPCOT is the most stable on party and non-party days. If your goal is to have shorter wait times at the Magic Kingdom, party days are your best bet. However, you must give up spending the evening at the park and no fireworks. And it's best to visit the other parks on a day the Magic Kingdom doesn't have a Mickey's Not So Scary Halloween Party event. What are wait times like during a Halloween Party itself? Check out the data from each event last year here: https://www.thrill-data.com/mnsshp/2023
-
July at Walt Disney World saw a fundamental change to how guests visit the theme parks with the introduction of the Lightning Lane Passes, which brough back prebooking of attractions with Multi Passes and Single Passes that disappeared with FastPass+ in March 2020. Only a week in, it is too early to tell what difference the new system is making in terms of overall wait times. We'll have more on that in the future, but, in the mean time, we are now tracking all current and future date Lightning Lane availability. July wait times were the lowest of 2024 so far with an average wait time of 30 minutes across the resort, down 2 minutes from June. This is a decrease of 6 minutes from July of last year, and 11 minutes from before the pandemic in 2019. Past July Monthly Averages 2019: July Average Wait Time - 41 minutes 2020: July Average Wait Time - 14 minutes 2021: July Average Wait Time - 40 minutes 2022: July Average Wait Time - 41 minutes 2023: July Average Wait Time - 36 minutes 2024: July Average Wait Time - 30 minutes Disney's Animal Kingdom July 2024 vs: Average Wait: Difference of -4.8 min / -12.8% July 2019: Difference of -17.1 min / -34.0% July 2020: Difference of 25.3 min / 274.4% July 2021: Difference of -8.7 min / -20.2% July 2022: Difference of -7.9 min / -19.4% July 2023: Difference of -3.5 min / -9.6% Wait times at Disney's Animal Kingdom were their lowest going back to 2019 outside of the COVID reopening month of July 2020. Wednesdays and Thursdays featured the lowest wait times while Fridays had the highest. Avatar Flight of Passage had the highest average wait times but guests spent less time in line than last July. EPCOT July 2024 vs: Average Wait: Difference of -8.6 min / -28.0% July 2019: Difference of -2.6 min / -10.6% July 2020: Difference of 7.6 min / 50.4% July 2021: Difference of -3.9 min / -15.0% July 2022: Difference of -6.3 min / -22.8% July 2023: Difference of -3.5 min / -14.6% EPCOT wait times were also lower in July than all but 2020 when going back to 2019, even with Test Track closed. The park was best avoided on Mondays with the travel transition day of Sunday featuring the lowest wait times. Remy's Ratatouille Adventure and Frozen Ever After had the longest average wait times (remember that Cosmic Rewind is still Virtual Queue and not included in the statistics). Disney's Hollywood Studios July 2024 vs: Average Wait: Difference of -10.6 min / -24.2% July 2019: Difference of -4.5 min / -11.8% July 2020: Difference of 13.1 min / 60.6% July 2021: Difference of -9.7 min / -22.2% July 2022: Difference of -12.9 min / -28.0% July 2023: Difference of -8.8 min / -21.0% Wait times at Disney's Hollywood Studios were down over 20% compared to July of last year. Weekends were the best time to visit the park with Monday, again, the day to avoid, if possible. Slinky Dog Dash had the highest average wait time of over 70 minutes, beating out Rise of the Resistance and the newly reopened Rock 'n' Roller Coaster. The Magic Kingdom July 2024 vs: Average Wait: Difference of -7.4 min / -26.2% July 2019: Difference of -14.1 min / -40.4% July 2020: Difference of 9.4 min / 73.8% July 2021: Difference of -11.9 min / -35.2% July 2022: Difference of -11.6 min / -35.2% July 2023: Difference of -5.6 min / -20.6% At the Magic Kingdom, wait times were also down over 20% compared to last July and over 40% compared to the pre-COVID year of 2019. Weekdays were busier than the weekends by several minutes, on average. Sundays, in particular, were the lightest overall. July saw the first full month of operation for Tiana's Bayou Adventure, which is not included in these statistics as it is Virtual Queue (which also goes for TRON). This helped to lower the wait times elsewhere in the park, bringing the overall average down. August brings back Mickey's Not So Scary Halloween Party to the Magic Kingdom, which impacts wait times there and at the other parks. We'll have more on that coming soon!
-
Lightning Lane Data Post 7-24?
Webmaster replied to JimmyD's topic in Lightning Lane Questions & Discussion/VQ
If you haven't seen it, the data is being tracked at https://www.thrill-data.com/lightning-lane -
On the second day of the Lightning Lane Multi Pass (LLMP) system, we can compare Lightning Lane availability on the last day of Genie+ operation (July 23rd) to the first one and half days of LLMP to identify any interesting features or trends. Lightning Lane availability can vary due to a wide range of factors; for this analysis, we tried to pick scenarios where typical Genie+ behavior was observed on its last day. In the following graphs, each dot represents a time of Lightning Lane availability at a time of day (X-axis) and its return time (Y-axis) [i.e. the time you can enter the Lightning Lane]. At the Magic Kingdom, Thunder Mountain saw a big change yesterday with the introduction of LLMP. Availability was very limited past 10:00 AM. Availability has been better today, but with later return times than observed with Genie+. Single Pass availability for TRON so far has been much more limited than with the Individual Lightning Lane on Tuesday. We haven't even captured an availability for Seven Dwarfs Mine Train today! Both the Haunted Mansion and Pirates of the Caribbean have seen less availability and at later return times than with Genie+. At Disney's Animal Kingdom, Lightning Lane availability isn't much different with the new system, including for Kilimanjaro Safaris or Avatar Flight of Passage. At Disney's Hollywood Studios, Runaway Railway has maintained good availability as a Tier 1 attraction, and Rock 'n' Roller Coaster is not too different. Slinky Dog Dash is hard to get regardless of the Lightning Lane system while Toy Story Mania availability has decreased later in the day. Slinky and Mania did have a significant drop of new availability this afternoon. Both the Tower of Terror and Rise of the Resistance have more limited availability. Tower of Terror did have a nice availability drop this afternoon as noted with a couple other attractions. At EPCOT, Spaceship Earth had almost instant availability with Genie+ but has become more limited with LLMP, likely as a popular Tier 2 choice. Soarin' seems to be the last pick for a Tier 1 attraction, boasting great availability so far. Frozen and Remy remain popular selections regardless of the Lightning Lane system, but have had same-day availability. Finally, Cosmic Rewind availability has been more limited as a Single Pass, but did feature a big afternoon drop yesterday. Mission: SPACE has seen quite a change in its availability with LLMP. Overall, availability with the new Lightning Lane passes remains limited with the premier attractions, which is not unexpected. Expect them to book up quickly during the 7 and 3 day book-ahead periods. With the ability to make 2 Tier selections, several attractions, such as Spaceship Earth, Haunted Mansion, and Toy Story Mania, has seen a big change in availability and are not as easy to obtain same day with the Multi Pass system as compared to Genie+. The lack of meet-and-greet Lightning Lanes also is also concentrating selections of different attractions too. The system is still new and it will be interesting to see how availability behavior changes over the coming days and weeks. Some of the availability drops observed this afternoon are encouraging too. You can find this data and more on any of the various Disney World pages on the site: https://www.thrill-data.com/waits/chain/wdw/
-
Video: Lightning Lane Multi Pass Purchasing by Date
Webmaster commented on Webmaster's blog entry in Data Bytes
From today, it seems to show the booking screens for the next 21 days. So I think you will be able to book everything tomorrow. -
Below, find the current and future pricing for Lightning Lane Multi Pass at Walt Disney World Resort. These are the current prices directly from the My Disney Experience app's API. It appears that the initial pricing for LLMP reflects the current Genie+ pricing scheme. However, the Park Hopper option is gone. Any guest with a Park Hopper ticket can book a Lightning Lane at another park after redeeming 1 Lightning Lane pass at the first park. This provides the opportunity for additional value compared to Genie+ (i.e. start at Animal Kingdom with the cheapest pricing and then Park Hop to the Magic Kingdom or Hollywood Studios). Note: it is possible that Disney could update the prices before the system launches on July 24th, but the current days have been aligned with the Genie+ pricing so far. Pricing is also much in-line with recent patterns. And be sure to check out the videos of the selection screens too. A sortable table version can be found at https://www.thrill-data.com/news/lightning-lane-multi-pass-pricing/ Note the graph has been scaled up to the peak price point observed with Genie+ of $39 per person and minimum price of $15 per person.
-
Video: Lightning Lane Multi Pass Purchasing by Date
Webmaster commented on Webmaster's blog entry in Data Bytes
You buy it for one park. After you have used at least one of your 3 selections, you can use it at another (as long as you have a Park Hopper ticket). -
Video: Lightning Lane Multi Pass Purchasing by Date
Webmaster commented on Webmaster's blog entry in Data Bytes
It's "there" but you have to use other tools to get to it as it is hidden from the interface.