Webmaster
-
Posts
1,478 -
Joined
-
Last visited
-
Days Won
24
Content Type
Profiles
Forums
Gallery
Events
How-To
Blogs
Everything posted by Webmaster
-
From the album: Blizzard Beach
-
From the album: Blizzard Beach
-
From the album: Blizzard Beach
-
From the album: Blizzard Beach
-

From the album: Blizzard Beach
-
From the album: Blizzard Beach
-

From the album: Blizzard Beach
-

From the album: Blizzard Beach
-
From the album: Blizzard Beach
-
From the album: Blizzard Beach
-
From the album: Blizzard Beach
-
From the album: Blizzard Beach
-
From the album: Blizzard Beach
-
From the album: Blizzard Beach
-
From the album: Blizzard Beach
-

From the album: Blizzard Beach
-

From the album: Blizzard Beach
-
From the album: Blizzard Beach
-
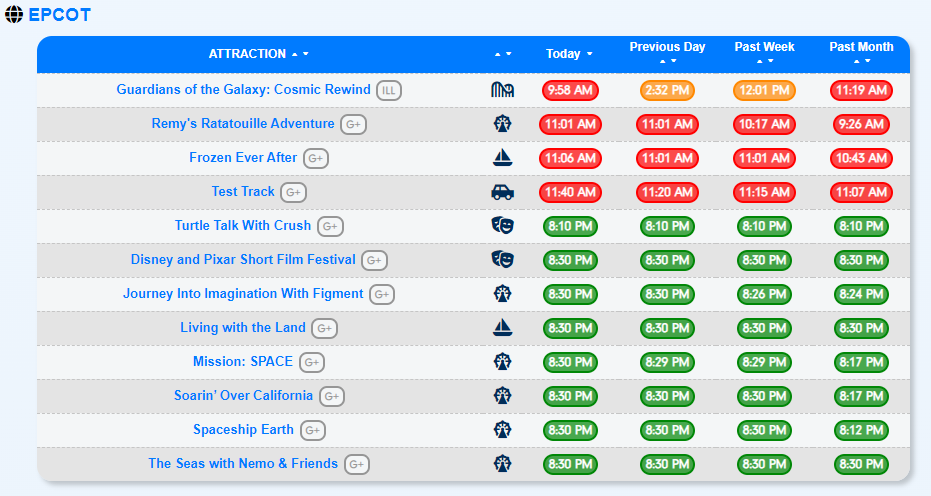
 Even on a slow Wednesday at Walt Disney World (3/6/2024), the Lightning Lane availability for Remy and Frozen was gone shortly after the second Genie+ selection point for many at 11 AM. Test Track did last a bit longer yesterday.
-
Should you avoid Disney World on Mondays? Should you go on Wednesday or Fridays? Should weekends be avoided or embraced? While Walt Disney World can be busy any day of the week, when analyzing the statistics over a period of time, better and worse days to visit each theme park do begin to stick out. Let's take a look at the numbers so far in 2024, and back at the data for 2022 and 2023 to give you some data to pick better days to visit! Note: this article will update over the course of 2024! Best/Worst Days 2024 As of May 13th, 2024 Resort wide, Mondays continue to be the busiest day to visit Walt Disney World overall. Weekends, especially Sundays, have been the lightest days to visit so far in 2024, on average. Park by park breakdowns are below, where the days do vary, and have changed some from past years. Right now, these sets feature four months worth of data, including the busy Spring Break season. Be sure to look at the 2023 and 2022 numbers further down for a broader picture. The Magic Kingdom Best Day (holidays included): Sunday - 26 minute average Worst Day (holidays included): Tuesday- 33 minute average Best Day (holidays excluded): Sunday - 26 minute average Worst Day (holidays excluded): Tuesday- 33 minute average EPCOT Best Day (holidays included): Wednesday - 33 minute average Worst Day (holidays included): Monday - 41 minute average Best Day (holidays excluded): Wednesday - 33 minute average Worst Day (holidays excluded): Monday - 41 minute average Disney's Hollywood Studios Best Day (holidays included): Wednesday/Sunday - 42 minute average Worst Day (holidays included): Monday/Friday - 46 minute average Best Day (holidays excluded): Wednesday/Sunday - 42 minute average Worst Day (holidays excluded): Monday/Friday - 46 minute average Disney's Animal Kingdom Best Day (holidays included): Wednesday - 39 minute average Worst Day (holidays included): Saturday- 48 minute average Best Day (holidays excluded): Wednesday - 39 minute average Worst Day (holidays excluded): Saturday - 48 minute average For reference, the best/worst days to visit in 2023 were: Best/Worst Days 2023 The Magic Kingdom Best Day (holidays included): Sunday - 26 minute average Worst Day (holidays included): Monday - 34 minute average Best Day (holidays excluded): Sunday - 26 minute average Worst Day (holidays excluded): Monday - 34 minute average EPCOT Best Day (holidays included): Wednesday - 29 minute average Worst Day (holidays included): Monday - 36 minute average Best Day (holidays excluded): Wednesday - 29 minute average Worst Day (holidays excluded): Monday - 36 minute average Disney's Hollywood Studios Best Day (holidays included): Sunday - 40 minute average Worst Day (holidays included): Monday/Tuesday/Friday - 46 minute average Best Day (holidays excluded): Sunday - 40 minute average Worst Day (holidays excluded): Monday/Tuesday/Friday - 46 minute average Disney's Animal Kingdom Best Day (holidays included): Wednesday - 35 minute average Worst Day (holidays included): Friday - 42 minute average Best Day (holidays excluded): Wednesday - 35 minute average Worst Day (holidays excluded): Friday - 42 minute average For reference, the best/worst days to visit in 2022 were: Best/Worst Days 2022 The Magic Kingdom Best Day (holidays included): Friday - 33 minute average Worst Day (holidays included): Monday - 40 minute average Best Day (holidays excluded): Friday - 33 minute average Worst Day (holidays excluded): Monday - 41 minute average EPCOT Best Day (holidays included): Sunday - 31 minute average Worst Day (holidays included): Monday - 38 minute average Best Day (holidays excluded): Saturday/Sunday - 31 minute average Worst Day (holidays excluded): Monday - 37 minute average Disney's Hollywood Studios Best Day (holidays included): Saturday - 48 minute average Worst Day (holidays included): Monday - 53 minute average Best Day (holidays excluded): Saturday - 49 minute average Worst Day (holidays excluded): Monday - 53 minute average Disney's Animal Kingdom Best Day (holidays included): Wednesday/Saturday - 41 minute average Worst Day (holidays included): Monday - 47 minute average Best Day (holidays excluded): Wednesday - 42 minute average Worst Day (holidays excluded): Monday/Tuesday/Friday - 46 minute average
-
An often spread notion is that an excellent time to visit Disney, either Disney World or Disneyland, is on Super Bowl Sunday, especially during the game itself. But is it really true? Let's take a deeper look at the wait time data from recent Super Bowls and surrounding days & weeks to figure out if the notion is true. An overall look at holidays around Super Bowl Sunday across all the Walt Disney World theme parks shows that Super Bowl Sunday has the lowest wait times of the days shown going back to 2014. On a park by park basis, we can see the same trend holds true, although some other days are equal to Super Bowl Sunday. Next is a comparison of the other Sundays around the Super Bowl for the past two years and for 2020, before the pandemic. Typically, only a week or two separates the Super Bowl from the very busy President's Day weekend, which leads to a busy Sunday after the Super Bowl. In 2023, Super Bowl Sunday (2/12/2023), shown above, was quite similar to the other non-holiday Sundays in the same time frame. In 2022, Super Bowl Sunday (2/13/2022) was busier than most of the non-holiday Sundays in the same time frame. In 2020, Super Bowl Sunday (2/2/2020) was about average for a Sunday over an 8 week period. Below is a look at the Super Bowl (2/12/2023) and the week that followed. Super Bowl Sunday wait times were right above the average or slightly below it for that week. A drop off around 6 to 7 PM can be observed each day of the week, and is not unique to Super Bowl Sunday. A look at attraction wait times from last year reveals that wait times were higher before the game started at 6:30 PM Eastern, with a noticeable change that typically occurs around dinner time. A closer look at the evening wait times on Super Bowl Sunday 2023. Here is a look at the wait times the Sunday before the Super Bowl last year. Wait times fell off a little less suddenly in the evening. Finally, a wide view of the first part of 2023, with the Super Bowl noted by the red mark. Click to see the larger image. You can see it is not one of the lowest days of the period. At Disneyland Resort, Super Bowl weekend has been busier than MLK Weekend and Valentine's Day. Both Disneyland Park and Disney California Adventure exhibit the same trend. \ At Disneyland Park, wait times were slightly lower on Super Sunday than the day prior. As the graphs below show, the Super Bowl in 2023 (on 2/12) is about average compared to 7 other surrounding Sundays, and average for the week after the Super Bowl. Wait times do not appear to appreciably drop off when the game started at 3:30 PM Pacific. Finally, the wide view of Super Sunday, denoted by the red mark, compared to a wider range of days across Disneyland Resort. Late January 2023 featured lower wait times than Super Bowl Weekend. For comparisons sake, a look at wait times at Universal Orlando reveals that Sunday wait times are lower than surrounding holidays, but higher than the Monday after the Super Bowl. The wider view of Universal Orlando shows that many days early in the year feature shorter overall wait times than Super Bowl Sunday. So what does all of this mean? At Walt Disney World and Universal Orlando, Super Bowl Sunday is typically similar to an average Sunday for early in the year that is not a holiday weekend. Nothing suggests it is less busy than an ordinary Sunday. At Disneyland Resort, Super Bowl Sunday is busier than MLK weekend and about average for a Sunday for the time of year. Overall, it doesn't seem like there is a specific reason to plan to visit Disney World, Disneyland, or Universal Orlando on Super Bowl Sunday for less crowds. It should be noted that Sunday is typically one of the better days to visit Disney or Universal, as the graphs below show. So maybe that is a good reason to plan for it if you aren't interested in the game.
-
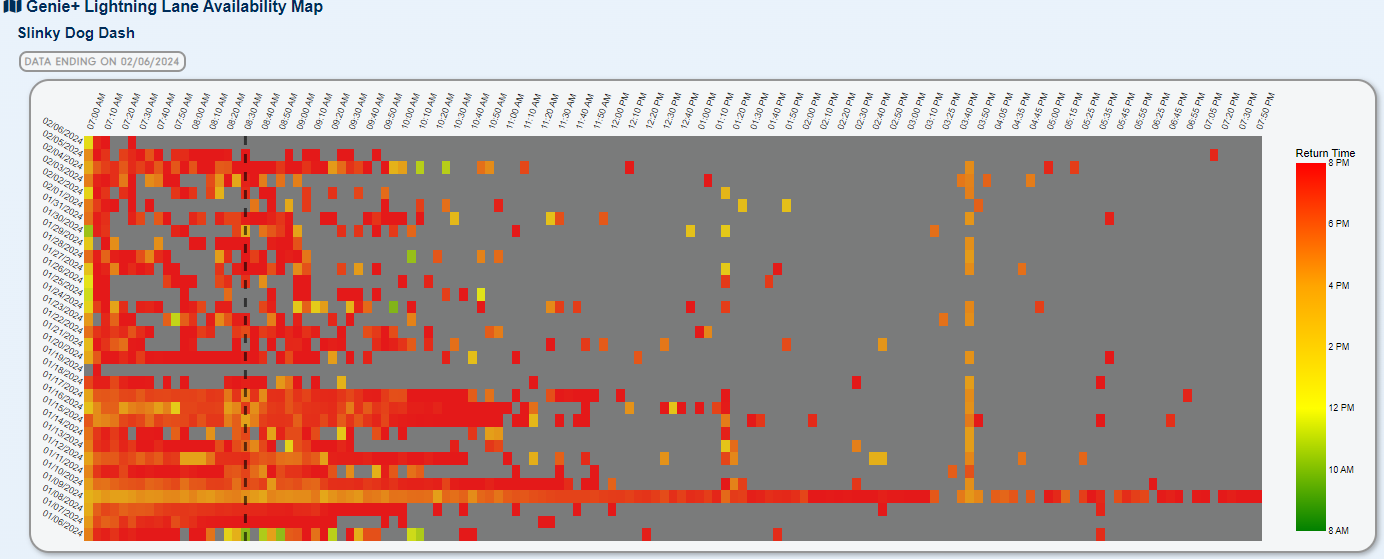
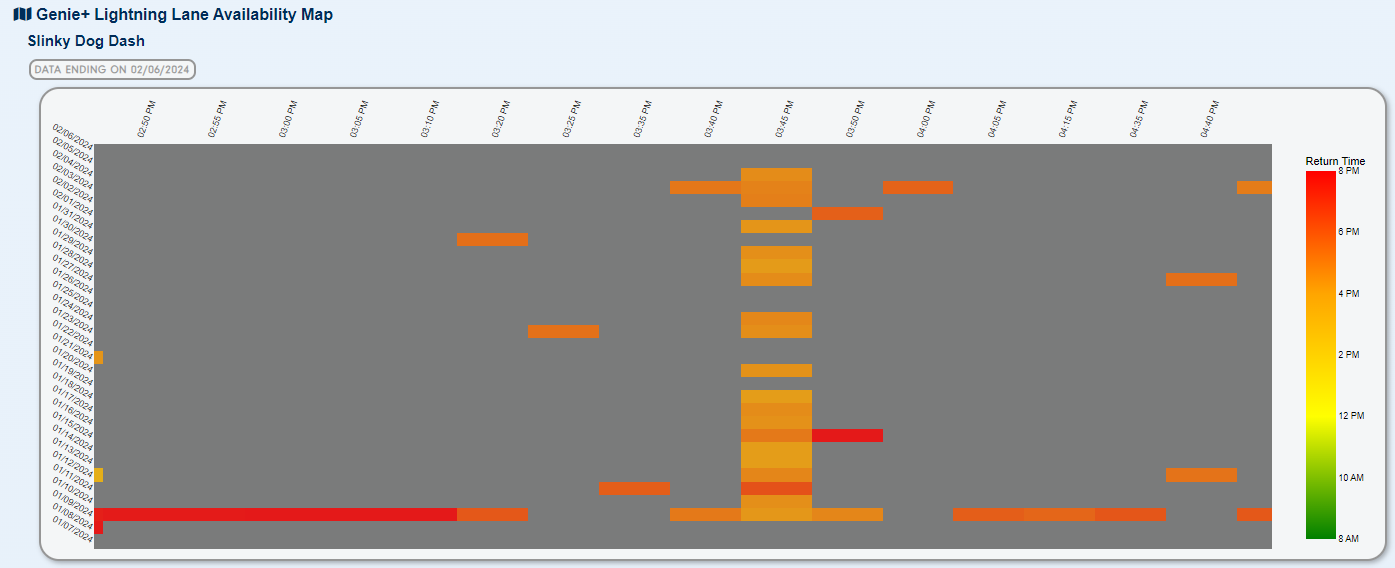
Based on recent data (from the Slinky Dog Dash page: https://www.thrill-data.com/waits/attraction/hollywood-studios/slinkydogdash/), a somewhat consistent release of additional Genie+ slots has been present over the past month. Between 3:40 and 3:50 PM, availability with a return time around 4:30 PM has been released on a majority of days in the past month. Likely a good a idea to keep refreshing during this period to try to snag a spot. Any similar Genie+ or Individual Lightning Lane attractions that exhibit consistent popup availability are tracked on the following page: https://www.thrill-data.com/lightning-lane/wdw/popup Genie+ for Slinky Dog Dash is in very high demand. The roller coaster often has a 100+ minute posted wait time throughout the day.
-
The first month of 2024 has already come and gone at the Walt Disney World Resort. There has been a lot of chatter about how busy the parks have been in what is traditionally a slower month for the resort. Let's take a look at the wait time data to see how true or not that was. Resort Wide Across Walt Disney World, the average wait time in January 2024 was down 9 minutes compared to January of last year. Compared to most of the months in 2023, it would have been considered a slower month, coming in with the 4th lowest average wait time over the past 13 months. The busiest week was the first week of the new year when many schools were still on holiday break. The Magic Kingdom At the Magic Kingdom, wait times in January 2024 were down compared to both '22 and '23, but up compared to '17 and '21. Note that 2019 is not included as data was incomplete. January 2024 vs: Average Wait: Difference of -1.1 min / -3.6% January 2017: Difference of 2.8 min / 11.0% January 2018: Difference of -5.6 min / -16.4% January 2020: Difference of -6.8 min / -19.4% January 2021: Difference of 3.0 min / 12.0% January 2022: Difference of -3.7 min / -11.4% January 2023: Difference of -1.9 min / -6.4% These were the average wait times by attraction. EPCOT At EPCOT, wait times in January 2024 were up compared to each year going back to 2017! It was mostly similar to last year overall. Note that 2019 is not included as data was incomplete. January 2024 vs: Average Wait: Difference of 2.8 min / 9.0% January 2017: Difference of 9.9 min / 41.8% January 2018: Difference of 4.6 min / 15.8% January 2020: Difference of 3.9 min / 13.0% January 2021: Difference of 10.5 min / 45.2% January 2022: Difference of 6.3 min / 22.8% January 2023: Difference of 0.7 min / 2.0% These were the average wait times by attraction. Disney's Hollywood Studios At Disney's Hollywood Studios, wait times in January 2024 were down over 11% compared to 2023, but up compared to the pre-pandemic years. Note that 2019 is not included as data was incomplete. January 2024 vs: Average Wait: Difference of 0.3 min / 0.6% January 2017: Difference of 21.1 min / 90.6% January 2018: Difference of 10.5 min / 31.2% January 2020: Difference of -0.7 min / -1.4% January 2021: Difference of 10.4 min / 30.6% January 2022: Difference of 0.9 min / 2.0% January 2023: Difference of -5.5 min / -11.2% These were the average wait times by attraction. Disney's Animal Kingdom At Disney's Hollywood Studios, wait times in January 2024 were down 2% compared to 2023, but up to 2022, 2021, and 2017. Note that 2019 is not included as data was incomplete. January 2024 vs: Average Wait: Difference of 3.5 min / 9.2% January 2017: Difference of 23.6 min / 130.2% January 2018: Difference of -9.9 min / -19.4% January 2020: Difference of -15.5 min / -27.4% January 2021: Difference of 16.6 min / 64.8% January 2022: Difference of 4.9 min / 13.4% January 2023: Difference of -0.9 min / -2.2% These were the average wait times by attraction. Overall, while the parks seemed busy in January 2024 to those who visited, wait times were actually lower everywhere, on average, except at EPCOT. As always, find data like this any time on the main site: https://www.thrill-data.com/
-
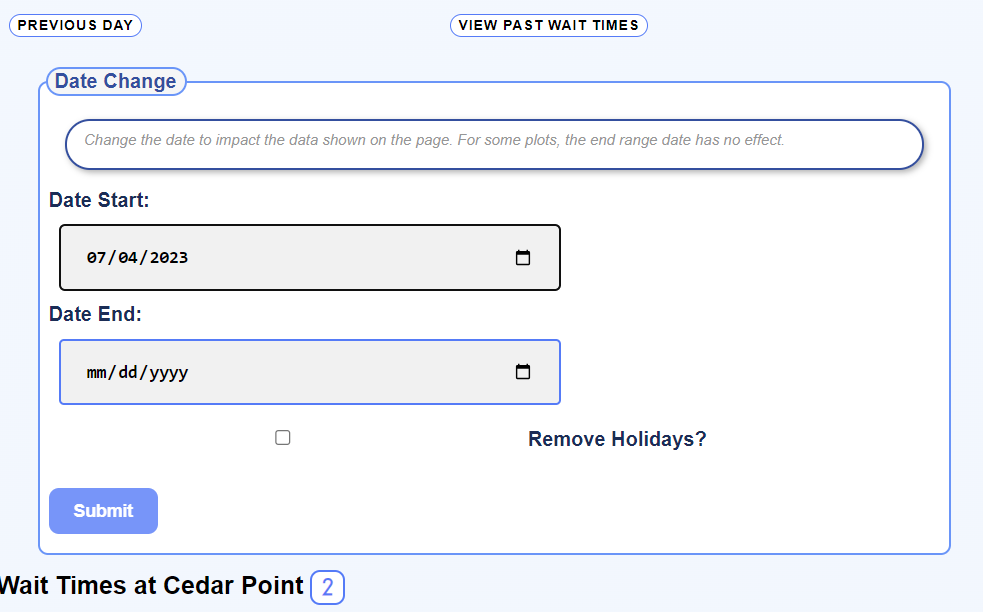
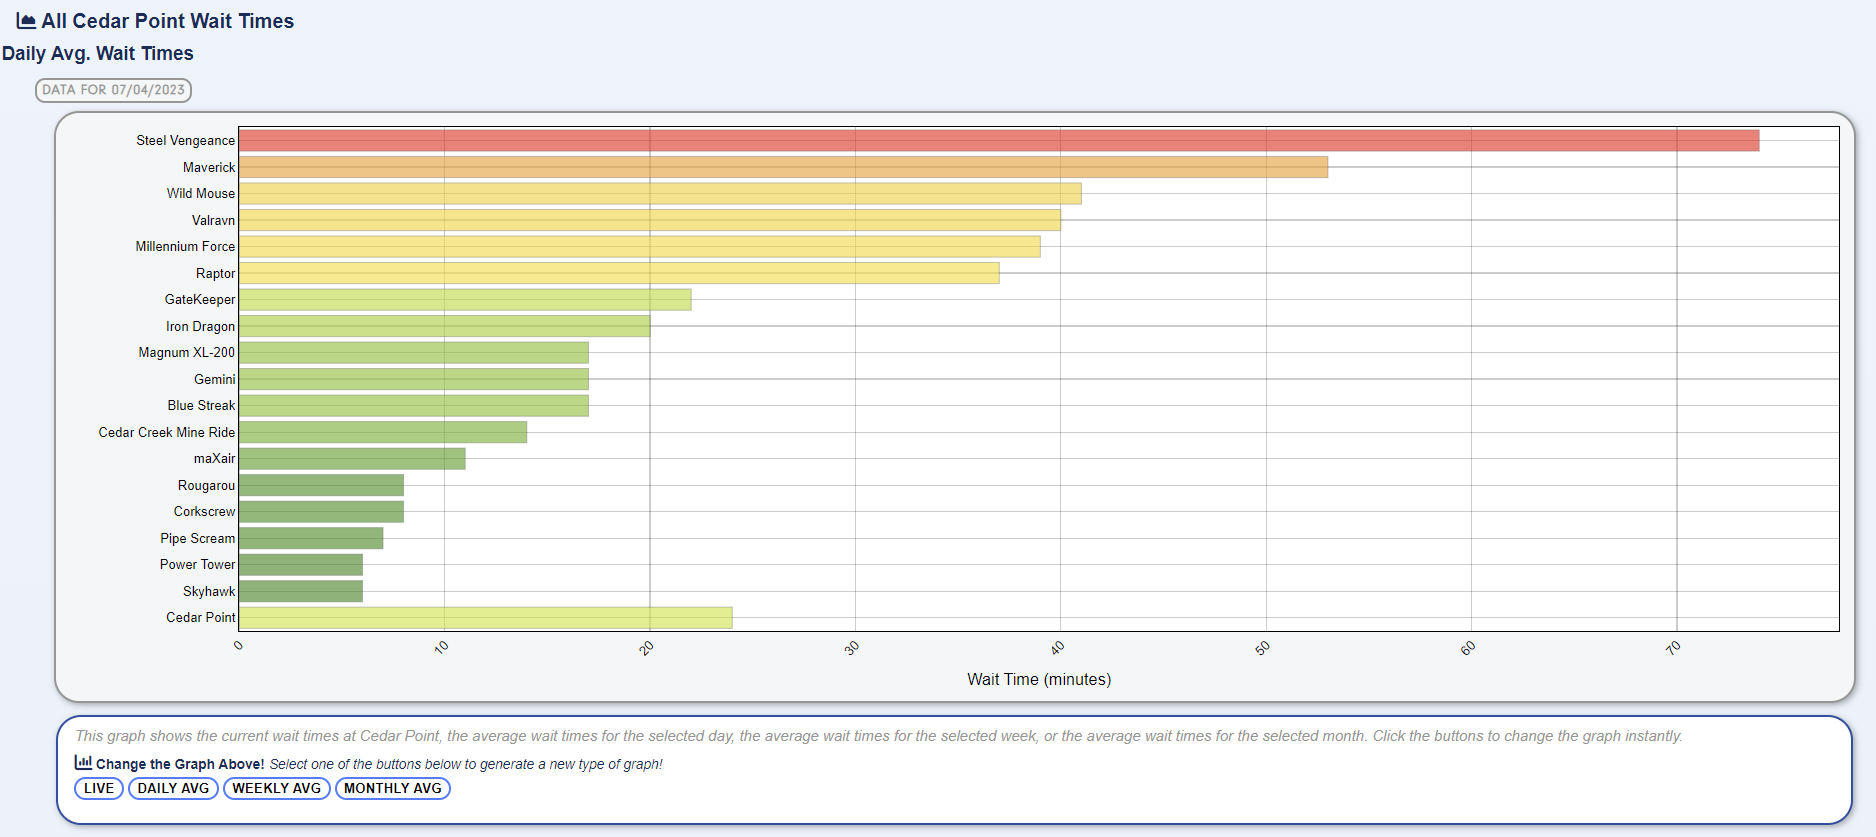
Not directly like the home page, but it is possible on a park by park basis. On a park's page, change the date near the top Then find the graph that looks like below, and click Daily Avg
-
-