Webmaster
-
Posts
1,478 -
Joined
-
Last visited
-
Days Won
24
Content Type
Profiles
Forums
Gallery
Events
How-To
Blogs
Everything posted by Webmaster
-

From the album: The Magic Kingdom
-
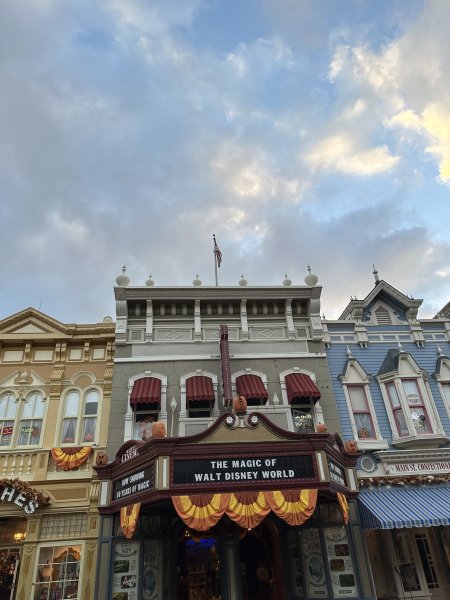
From the album: The Magic Kingdom
-

From the album: The Magic Kingdom
-

From the album: The Magic Kingdom
-

From the album: The Magic Kingdom
-

From the album: The Magic Kingdom
-

From the album: The Magic Kingdom
-

From the album: The Magic Kingdom
-

From the album: The Magic Kingdom
-
Here are some posted versus actual wait times from Disneyland Paris. Quite a few where the actual was higher than posted. Blanche-Neige et les Sept Nains Posted Wait: 15 minutes User Reported Wait: 12 minutes Les Voyages de Pinocchio Posted Wait: 15 minutes User Reported Wait: 8 minutes Mad Hatter's Tea Cups Posted Wait: 5 minutes User Reported Wait: 3 minutes 'it's a small world' Posted Wait: 5 minutes User Reported Wait: 10 minutes Pirates of the Caribbean Posted Wait: 5 minutes User Reported Wait: 1 minutes Pirates of the Caribbean Posted Wait: 5 minutes User Reported Wait: 1 minutes Star Tours: The Adventures Continue Posted Wait: 5 minutes User Reported Wait: 19 minutes Le Carrousel de Lancelot Posted Wait: 5 minutes User Reported Wait: 9 minutes Le Pays des Contes de Fees Posted Wait: 5 minutes User Reported Wait: 8 minutes Casey Jr. – le Petit Train du Cirque Posted Wait: 10 minutes User Reported Wait: 20 minutes Thunder Mesa Riverboat Landing Posted Wait: 10 minutes User Reported Wait: 11 minutes
-
Some more reported wait times from last night Bloodmoon: Dark Offerings Posted Wait: 50 minutes User Reported Wait: 37 minutes Bloodmoon: Dark Offerings Posted Wait: 35 minutes User Reported Wait: 37 minutes Dueling Dragons: Choose Thy Fate Posted Wait: 35 minutes User Reported Wait: 22 minutes YETI: Campground Kills Posted Wait: 25 minutes User Reported Wait: 20 minutes Bloodmoon: Dark Offerings Posted Wait: 15 minutes User Reported Wait: 8 minutes
-
Here are some actual versus posted wait times as reported by Thrill Data users over the weekend for Halloween Horror Nights 32 at Universal Studios Florida Wait 45 minutes (Posted 45 minutes) for The Exorcist: Believer Wait 85 minutes (Posted 75 minutes) for Stranger Things 4 Wait 45 minutes (Posted 35 minutes) for Dueling Dragons: Choose Thy Fate Wait 20 minutes (Posted 55 minutes) for YETI: Campground Kills Wait 43 minutes (Posted 45 minutes) for Universal Monsters: Unmasked Wait 39 minutes (Posted 35 minutes) for YETI: Campground Kills Wait 14 minutes (Posted 35 minutes) for Dueling Dragons: Choose Thy Fate Wait 30 minutes (Posted 35 minutes) for The Exorcist: Believer Wait 13 minutes (Posted 45 minutes) for Bloodmoon: Dark Offerings Wait 15 minutes (Posted 50 minutes) for Stranger Things 4 Wait 15 minutes (Posted 20 minutes) for Chucky: Ultimate Kill Count Wait 16 minutes (Posted 20 minutes) for Universal Monsters: Unmasked Wait 12 minutes (Posted 25 minutes) for The Darkest Deal Wait 19 minutes (Posted 25 minutes) for Dr. Oddfellow’s Twisted Origins Wait 22 minutes (Posted 45 minutes) for The Last of Us Wait 18 minutes (Posted 20 minutes) for Dr. Oddfellow’s Twisted Origins Wait 24 minutes (Posted 35 minutes) for Universal Monsters: Unmasked Wait 39 minutes (Posted 40 minutes) for The Darkest Deal Wait 26 minutes (Posted 35 minutes) for Dr. Oddfellow’s Twisted Origins Wait 42 minutes (Posted 25 minutes) for Universal Monsters: Unmasked Wait 30 minutes (Posted 5 minutes) for The Last of Us
-
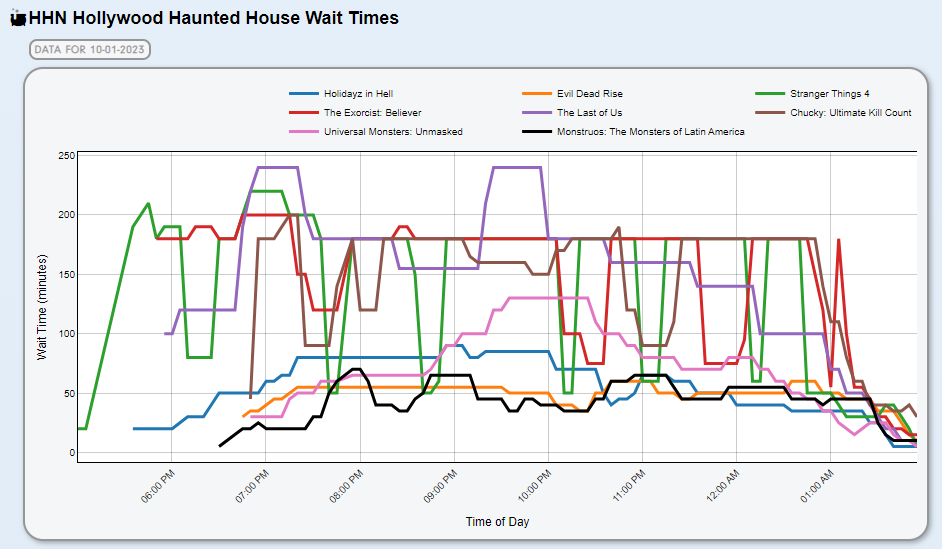
Last Sunday night, wait times at Halloween Horror Nights at Universal Studios Hollywood averaged 112 minutes! That is nearly 2 hours per haunted house. Find all the data at https://www.thrill-data.com/hhn/hollywood/2023/10_01_2023

-
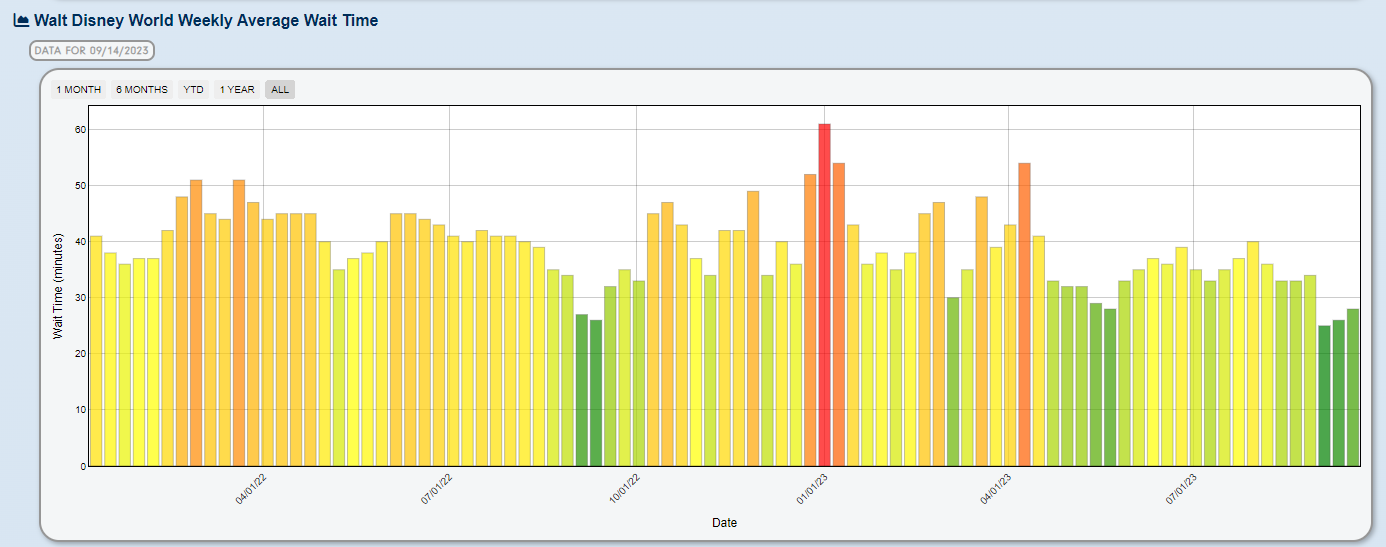
Welcome to October and month 2 and a half of Spooky Season. September has historically been a lighter month across the resort with school beginning. With September now gone, how did wait times compare this past month to September of previous years across Walt Disney World? Let's take a look at the data. Disney's Animal Kingdom Wait times at DAK in September were down compared to each year going back to 2017 except for 2021. They were down nearly 30% compared to the average over the year. September 2023 vs: Average Wait: Difference of -10.9 min / -28.6% September 2017: Difference of -6.6 min / -19.4% September 2018: Difference of -1.8 min / -6.2% September 2019: Difference of -1.4 min / -5.0% September 2021: Difference of 12.2 min / 73.6% September 2022: Difference of -0.4 min / -1.6% EPCOT This September was a busy month at EPCOT, with wait times higher than years going back to 2017. The month would be considered slightly below average compared to the average of all months in the year. September 2023 vs: Average Wait: Difference of -2.8 min / -9.4% September 2017: Difference of 3.6 min / 16.6% September 2018: Difference of 3.5 min / 15.8% September 2019: Difference of 5.4 min / 26.8% September 2021: Difference of 12.6 min / 85.0% September 2022: Difference of 3.8 min / 17.6% Disney's Hollywood Studios DHS wait times were up compared to most past Septembers except for last year. Compared to the yearly average, wait times were down nearly 26%. September 2023 vs: Average Wait: Difference of -11.7 min / -25.8% September 2017: Difference of 11.0 min / 55.2% September 2018: Difference of 6.8 min / 30.0% September 2019: Difference of 7.1 min / 30.6% September 2021: Difference of 8.1 min / 32.0% September 2022: Difference of -3.7 min / -10.0% The Magic Kingdom Wait times last month at the Magic Kingdom were up over 2019 and 2021, but down compared to 2017, 2018, and 2022. September 2023 vs: Average Wait: Difference of -7.8 min / -26.2% September 2017: Difference of -2.0 min / -9.2% September 2018: Difference of -0.1 min / -0.8% September 2019: Difference of 0.1 min / 0.6% September 2021: Difference of 4.6 min / 28.6% September 2022: Difference of -3.3 min / -14.2% Wait times did peak a bit unusually the week of September 18th, likely aided by some fall breaks, as seen below in the breakdown of September 2023 wait times by week at the Magic Kingdom. Looking ahead, October is typically busier than September, with more fall breaks and a holiday (plus Halloween).
-
Halloween Horror Nights 32 (HHN32) has been underway for almost a month at Universal Studios Florida. This year's event has been as popular as ever, averaging close an hour wait time for the houses each night, and with little difference between weekday and weekend events (i.e. no slow day to go). Let's take a look at some of the data that Thrill Data users have provided. The graph below shows the event average wait times so far in 2023 as reported by the Universal Orlando app. Posted vs Actual Wait Times at HHN 32 in 2023 Actual Wait 40 minutes (Posted 75 minutes) for The Darkest Deal Actual Wait 34 minutes (Posted 60 minutes) for YETI: Campground Kills Actual Wait 83 minutes (Posted 120 minutes) for Stranger Things 4 Actual Wait 40 minutes (Posted 45 minutes) for Bloodmoon: Dark Offerings Actual Wait 19 minutes (Posted 25 minutes) for Chucky: Ultimate Kill Count Actual Wait 14 minutes (Posted 10 minutes) for Dr. Oddfellow’s Twisted Origins Actual Wait 10 minutes (Posted 15 minutes) for The Darkest Deal Actual Wait 4 minutes (Posted N/A minutes) for Dr. Oddfellow’s Twisted Origins Actual Wait 15 minutes (Posted N/A minutes) for Universal Monsters: Unmasked Actual Wait 32 minutes (Posted 40 minutes) for Dueling Dragons: Choose Thy Fate Actual Wait 29 minutes (Posted 50 minutes) for The Darkest Deal Actual Wait 63 minutes (Posted 85 minutes) for The Last of Us Actual Wait 25 minutes (Posted 5 minutes) for The Darkest Deal Actual Wait 5 minutes (Posted 10 minutes) for Dr. Oddfellow’s Twisted Origins Actual Wait 17 minutes (Posted N/A minutes) for Universal Monsters: Unmasked Actual Wait 19 minutes (Posted 50 minutes) for Stranger Things 4 Actual Wait 12 minutes (Posted 60 minutes) for YETI: Campground Kills Actual Wait 3 minutes (Posted 35 minutes) for Dueling Dragons: Choose Thy Fate Actual Wait 33 minutes (Posted 25 minutes) for Chucky: Ultimate Kill Count Actual Wait 18 minutes (Posted 35 minutes) for The Exorcist: Believer Actual Wait 21 minutes (Posted 30 minutes) for Bloodmoon: Dark Offerings Actual Wait 23 minutes (Posted 90 minutes) for Stranger Things 4 Actual Wait 41 minutes (Posted 35 minutes) for The Darkest Deal Actual Wait 16 minutes (Posted 10 minutes) for Dr. Oddfellow’s Twisted Origins Actual Wait 28 minutes (Posted N/A minutes) for Universal Monsters: Unmasked Actual Wait 22 minutes (Posted 45 minutes) for The Last of Us Actual Wait 18 minutes (Posted 20 minutes) for Dr. Oddfellow’s Twisted Origins Actual Wait 24 minutes (Posted 35 minutes) for Universal Monsters: Unmasked Actual Wait 39 minutes (Posted 40 minutes) for The Darkest Deal Actual Wait 26 minutes (Posted 35 minutes) for Dr. Oddfellow’s Twisted Origins Actual Wait 42 minutes (Posted 25 minutes) for Universal Monsters: Unmasked Actual Wait 30 minutes (Posted 5 minutes) for The Last of Us Actual Wait 15 minutes (Posted 50 minutes) for Stranger Things 4 Actual Wait 15 minutes (Posted 20 minutes) for Chucky: Ultimate Kill Count Actual Wait 16 minutes (Posted 20 minutes) for Universal Monsters: Unmasked Actual Wait 12 minutes (Posted 25 minutes) for The Darkest Deal Actual Wait 19 minutes (Posted 25 minutes) for Dr. Oddfellow’s Twisted Origins Actual Wait 39 minutes (Posted 35 minutes) for YETI: Campground Kills Actual Wait 14 minutes (Posted 35 minutes) for Dueling Dragons: Choose Thy Fate Actual Wait 30 minutes (Posted 35 minutes) for The Exorcist: Believer Actual Wait 13 minutes (Posted 45 minutes) for Bloodmoon: Dark Offerings The good news is that there are more instances of wait times posted by Universal being overreported than underreported. Now, individual experiences will differ, but it is encouraging that wait times are not always as high as advertised. Keep in mind that if the Express line is backed up, the standby wait time will likely be longer as a consequence. Visiting HHN this year in Orlando or Hollywood? Record your time in the lines too to help everyone out! Visit any of the houses pages to get started! Remember to follow all of the HHN action all season long at https://www.thrill-data.com/hhn/orlando/2023. Get the most up-to-date data on what days to visit HHN and when houses have the lowest and highest wait times.
-
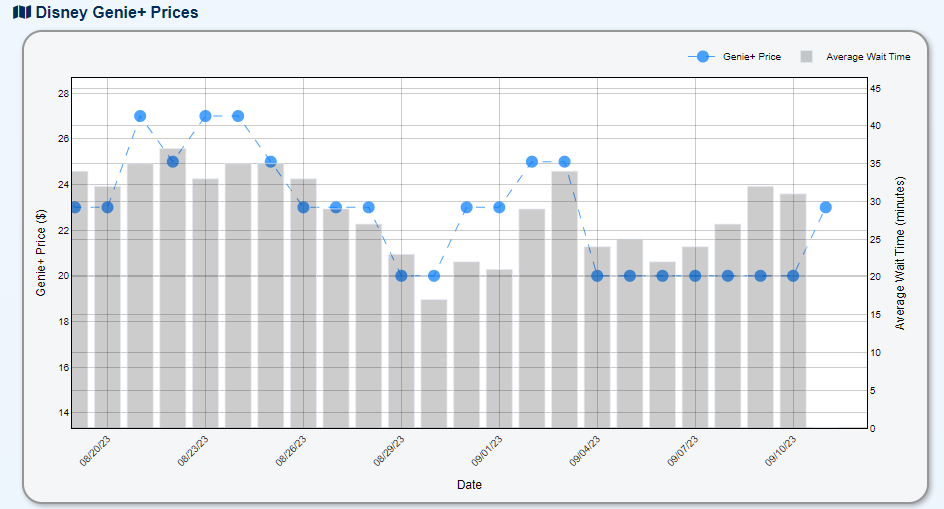
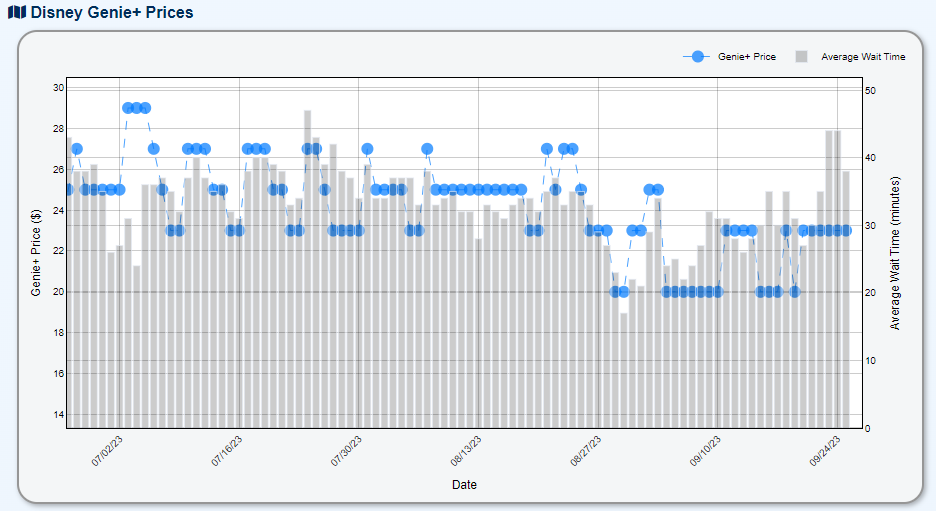
 At Walt Disney World Resort, the past several days across the theme parks have been unseasonably busy. Over these same days, the price for Disney Genie+ has remained at a maximum price of $23 per person for Park Hopper or the Magic Kingdom. This is a pretty good value considering that the wait times suggest that the price should be at least $27 based on past data. . Find the Genie+ price history any time at https://www.thrill-data.com/lightning-lane/wdw/price-history
-
Last night, heavy rain in Orlando wreaked havoc on HHN 32, closing several houses for most of the night Follow the HHN action any time at https://www.thrill-data.com/hhn/orlando/2023
-
A wild bear wondered into the Magic Kingdom today, leading to the closure of Adventureland, Frontierland, and Liberty Square. These closures wreaked havoc on the wait times at the park today, leading the average wait time to be its highest in the past 6 months! Adventureland and Liberty Square reopened at 12:31 PM. As of 1:05 PM, Frontierland, including Big Thunder Mountain Railroad, is open. Blocks of white indicate ride closures. With a limited number of attractions available, wait times grew significantly for those that were open. How extreme did Fantasyland and Tomorrowland get? Well, it is not often that the Carousel reaches a 35 minute wait time! Wait times will likely remain above average for awhile today, as the backlog of Lightning Lane slots gets processed through the attractions that were closed. Many of these attractions filled up availability before more has appeared (indicated by the gray in the graph below).
-
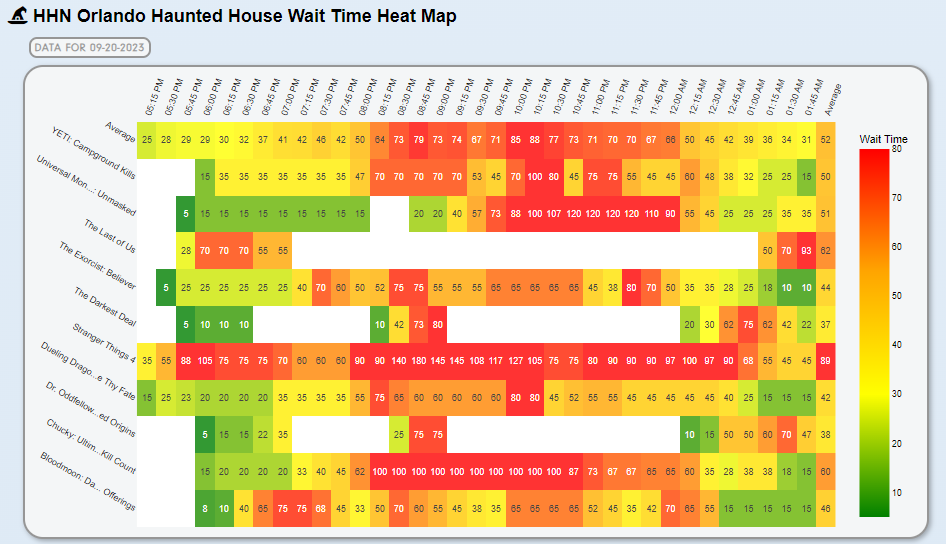
Halloween Horror Nights, HHN for short, is in at least its second week at both Universal Studios Florida and Universal Studios Hollywood. Both events are historically popular, but the events during the month of September are usually a bit more mild in terms of wait times. Has that story held true in 2023? During HHN 31 at Universal Studios Florida last year, the highest average wait time for any given event (the average wait time of each haunted house on a given night) was 64 minutes on 10/19/2022. Last night at HHN 32, on 9/17/2023, the average wait time was 69 minutes! Previous to last night, the average had hovered closer to 58 minutes. Last September, the highest nightly average was 58 minutes, which happened twice. Stranger Things 4 and The Last of Us have been driving the average wait times up so far. Reasonable wait times can be had for many of the houses early on (outside of ST4 and TLOU), and later on in the night, especially if you can stay past 12 AM. For all the data, updating during and after each HHN event, be sure to check out of HHN page at https://www.thrill-data.com/hhn/orlando/2023 At HHN Hollywood, average house wait times are even higher than Orlando, and higher than wait times during last year's event. During HHN 2022, the highest average wait time was 90 minutes on 9/24/2022; during the event last night (9/17/2023), the average wait time was a whopping 96 minutes! Based upon wait times, the most popular house at HHN Hollywood has been Chucky: Ultimate Kill Count followed by Stranger Things 4 and The Last of Us. Last night, several of the houses saw some dramatic swings up and down, and wait times remained high most of the night. Like HHN Orlando, follow all of the HHN Hollywood data all season long at https://www.thrill-data.com/hhn/hollywood/2023
-
A look at how wait times ebb and flow around the Magic Kingdom on a Friday with a Halloween Party
-
Compared to last week, wait times across Walt Disney World are up 2 minutes over last week so far
-
After a week at the $20 per person price point for MK/Park Hopper, the Genie+ price jumped up to a maximum of $23 per person today https://www.thrill-data.com/lightning-lane/wdw/price-history
-
Here are a few actual wait times at Halloween Horror Nights 32 (HHN 32) compared to their posted wait times Wait 34 Posted 60 for YETI: Campground Kills Wait 83 Posted 120 for Stranger Things 4 Wait 20 Posted 45 for YETI: Campground Kills Wait 40 Posted 45 for Bloodmoon: Dark Offerings Wait 19 Posted 25 for Chucky: Ultimate Kill Count Wait 32 Posted 40 for Dueling Dragons: Choose Thy Fate
-
It was well publicized in the national media that the Fourth of July weekend at Walt Disney World this year was particularly slow. A large contributor to this was block outs for the $89 per day ticket deals and Passholders. This same scenario occurred over the past Labor Day weekend holiday. So were wait times low across Walt Disney World again on the latest holiday weekend? First, a comparison for each Disney World theme park between the 4th of July weekend, Labor Day weekend, a non-holiday last weekend of August (a recent week for comparison), and the average wait time profile for the past year plus. The weekend averages include the wait times from Saturday through Monday (it does include Tuesday, the 4th for July). At all but the Magic Kingdom (likely due to Halloween Party on Labor Day itself), wait times on Labor Day weekend were at least 2% higher than the 4th of July weekend. EPCOT wait times were up 16% over that weekend. At all but EPCOT, wait times were down over Labor Day weekend compared to the last weekend of August by 5 to 12%. Compared to the past year plus average wait time profile, wait times were down at each Disney World theme park 7 to 33% over Labor Day weekend 2023! Over the past two major US holidays, Disney World wait times have been well below average. This, again like the 4th of July, shows the power of a better deal. Guests are choosing to visit on other weekends for less overall cost than on holidays with no deals, but lower crowds. Animal Kingdom Date Range: 09/02/2023 to 09/04/2023 vs: Average Wait: Difference of -12.1 min / -31.4% Animal Kingdom Date Range: 07/01/2023 to 07/04/2023: Difference of 1.6 min / 6.2% Animal Kingdom Date Range: 08/26/2023 to 08/28/2023: Difference of -1.6 min / -5.8% EPCOT Date Range: 09/02/2023 to 09/04/2023 vs: Average Wait: Difference of -2.3 min / -7.6% EPCOT Date Range: 07/01/2023 to 07/04/2023: Difference of 3.5 min / 16.0% EPCOT Date Range: 08/26/2023 to 08/28/2023: Difference of 3.3 min / 14.6% Hollywood Studios Date Range: 09/02/2023 to 09/04/2023 vs: Average Wait: Difference of -15.2 min / -33.2% Hollywood Studios Date Range: 07/01/2023 to 07/04/2023: Difference of 0.7 min / 2.4% Hollywood Studios Date Range: 08/26/2023 to 08/28/2023: Difference of -4.1 min / -12.2% Magic Kingdom Date Range: 09/02/2023 to 09/04/2023 vs: Average Wait: Difference of -10.0 min / -32.0% Magic Kingdom Date Range: 07/01/2023 to 07/04/2023: Difference of -2.0 min / -9.2% Magic Kingdom Date Range: 08/26/2023 to 08/28/2023: Difference of -1.1 min / -5.0% How did Labor Day weekend wait times compare to past years? Each day of this past weekend was slightly down from last year, except for a bigger drop on Labor Day Monday. Labor Day was also a Halloween Party on the Magic Kingdom last year, which does not explain that delta. Labor Day weekend at Disney World, in general, hasn't been as busy since the 2017/2018 time frame. 2020 data is hard to take to seriously as the socially distanced queues inflated wait times considerably.
-
August has quickly come and gone, and now we enter the fall season at the Disney theme parks, with Halloween events, and, typically, lower wait times with kids back in school. How did August wait times in 2023 compare to previous years? Let's take a look. Disney's Animal Kingdom At DAK, August wait times this year were down compared to last year and before the pandemic, but up over 2021. The Flight of Passage wait time being lower is a huge factor in this drop. August 2023 vs: Average Wait: Difference of -8.5 min / -22.2% August 2019: Difference of -12.6 min / -31.2% August 2021: Difference of 9.1 min / 42.8% August 2022: Difference of -4.6 min / -13.4% EPCOT At EPCOT, August wait times were higher, on average, than each August going back to 2019. Wait times were down about 4% from the yearly average wait time. August 2023 vs: Average Wait: Difference of -4.1 min / -13.4% August 2019: Difference of 1.7 min / 7.2% August 2021: Difference of 10.8 min / 67.6% August 2022: Difference of 0.2 min / 0.8% Disney's Hollywood Studios At DHS, August wait times were down nearly 5% compared to last year, but were up over 2019 and 2021. August was almost 16% below the yearly average Hollywood Studios wait time. August 2023 vs: Average Wait: Difference of -7.1 min / -15.8% August 2019: Difference of 4.5 min / 13.6% August 2021: Difference of 9.9 min / 33.6% August 2022: Difference of -1.8 min / -4.6% The Magic Kingdom At the Magic Kingdom, August wait times were down compared 2019 and 2022, but up over 2021. The average wait time in August was down nearly 20% compared to the yearly average, indicating wait times were reasonable. August 2023 vs: Average Wait: Difference of -5.9 min / -19.8% August 2019: Difference of -6.1 min / -21.4% August 2021: Difference of 1.2 min / 5.6% August 2022: Difference of -3.7 min / -14.4% Disney California Adventure At DCA, August wait times were down over 16% compared to last year, but up over 30% over 2021. Wait times were also well below the yearly average, down 24%. August 2023 vs: Average Wait: Difference of -7.1 min / -24.2% August 2019: Difference of -0.3 min / -1.2% August 2021: Difference of 5.9 min / 34.2% August 2022: Difference of -4.5 min / -16.6% Disneyland At Disneyland, August wait times were down almost 14% compared to last year, but were up over 20% compared to before the pandemic. Wait times, on average, were down 5 minutes compared to the yearly average. August 2023 vs: Average Wait: Difference of -4.8 min / -18.0% August 2019: Difference of 3.6 min / 20.2% August 2021: Difference of 6.3 min / 39.2% August 2022: Difference of -3.5 min / -13.8% Disneyland Paris At DLP, August wait times were down 18% compared to last year and down 7% compared to the yearly average. Average Wait: Difference of -1.6 min / -7.0% August 2019: Difference of 0% August 2021: Difference of 0.9 min / 4.6% August 2022: Difference of -4.3 min / -18.2% Tokyo Disneyland At TDR, August wait times were slightly higher than August of last year, and up nearly 23% over the yearly average. August 2023 vs: Average Wait: Difference of 4.1 min / 22.8% August 2019: Difference of 0% August 2021: Difference of 13.7 min / 158.6% August 2022: Difference of 0.1 min / 0.6% Tokyo DisneySea At DisneySea, August wait times were up over 8% compared to last August, and up 22% over the yearly average. More capacity at the Tokyo parks has led to these increases. August 2023 vs: Average Wait: Difference of 5.4 min / 22.0% August 2019: Difference of 0% August 2021: Difference of 19.5 min / 171.0% August 2022: Difference of 2.2 min / 8.4%
.gif.751534c99b752d3cd81f5a7c084165bd.gif)