Webmaster
-
Posts
1,478 -
Joined
-
Last visited
-
Days Won
24
Content Type
Profiles
Forums
Gallery
Events
How-To
Blogs
Everything posted by Webmaster
-
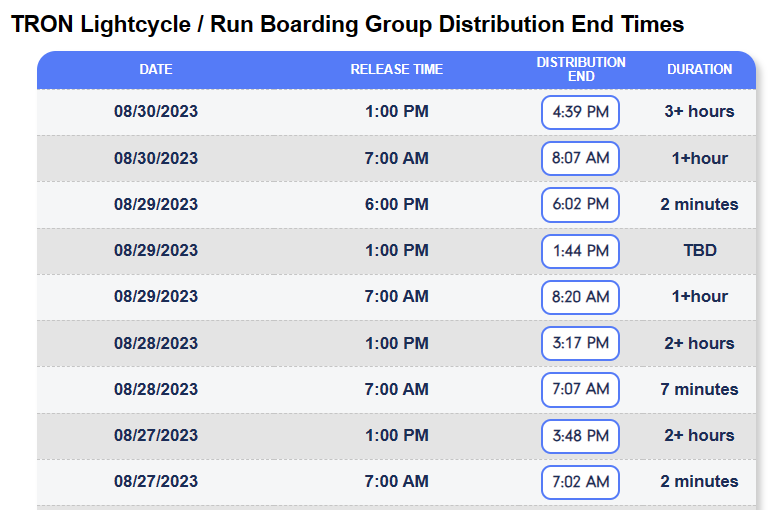
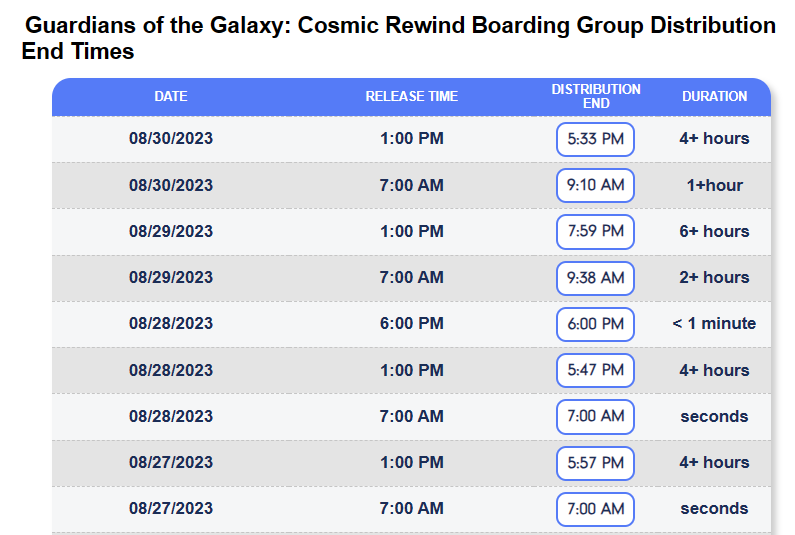
Along with the low wait times this week thanks to the hurricane, boarding group availability for TRON and Cosmic Rewind has been very good too, even at 7 AM the past 2 days.

-
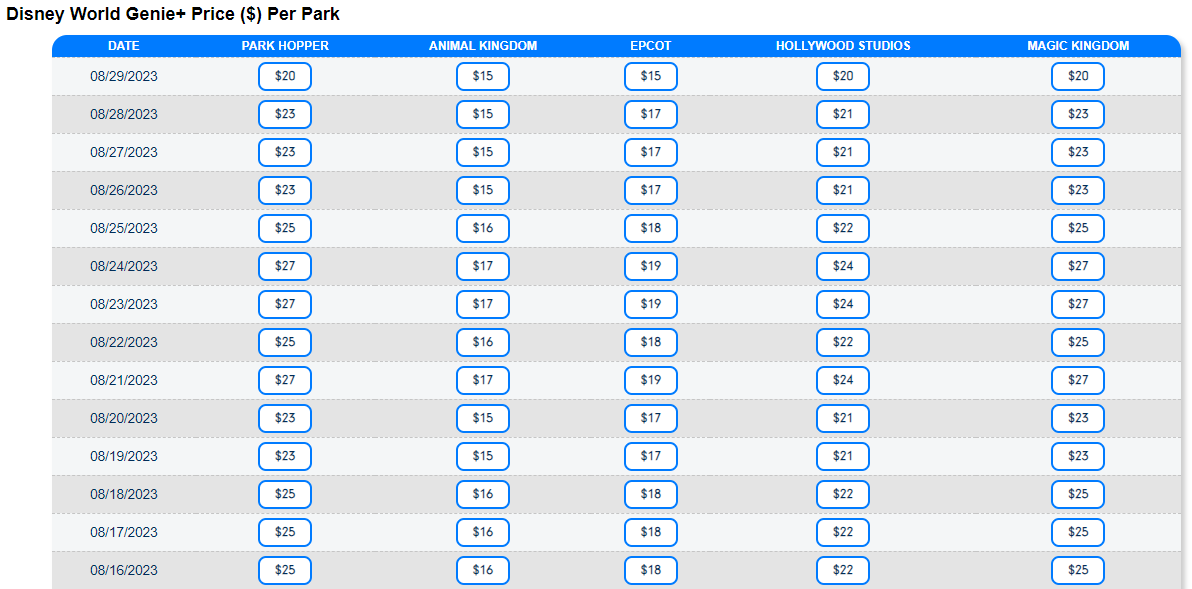
Today, the maximum price for Disney Genie+ at Walt Disney World is $20 per person, it's lowest value since June 18th. It is also the lowest price since switching to the per park pricing model. Also of note is that the Magic Kingdom and Hollywood Studios are the same price for the first time since the variable park pricing from introduced. Find this data any time at https://www.thrill-data.com/news/disney-world-genie-plus-price-tracker/
-
This week (8/21 to 8/27/2023), wait times across Walt Disney World were up 1 minute as compared to last week, with an average wait time of 34 minutes (last week was flat compared to the previous week, for reference). Out of the past 86 weeks, this week would rank #69. The same week last year also ranks #69 with an average wait time of 34 minutes. After a slow start to the summer this year, the back end is the same as last year. The weekend, once again, had the lowest wait times of the past week, with Sunday clearly the lowest. Disney's Animal Kingdom At DAK, the hardest Lightning Lane slot to obtain later in the day was meeting Mickey and Minnie, followed by Avatar Flight of Passage. Both Pandora rides had the longest average wait times. EPCOT At EPCOT, Lightning Lane slots for the big 3 attractions all sold out within a 30 minute period, on average, before 1 PM each day. It remains hard to get Genie+ for all 3. Frozen Ever After led the way for the longest average wait time. Disney's Hollywood Studios At DHS, Slinky Dog Dash remained the hardest Genie+ slot to obtain, selling out before noon. The roller coaster also had the highest average wait time for the week. The Magic Kingdom At MK, Lightning Lane availability was generally plentiful. Days with a Mickey's Not-So-Scary Halloween Party (MNSSHP) continued to have low wait times along with Sunday. Seven Dwarfs Mine Train and Peter Pan's Flight featured the longest wait times, on average, for the week.
-
 Wait times on the last Sunday of August going back to 2019 at each Walt Disney World theme park
-
Down I-4 from Universal Orlando, the data showed that wait times are significantly lower at the Magic Kingdom during days when there is a Halloween Party. Does the same conclusion hold true at both Islands of Adventure and Universal Studios Florida on days where Halloween Horror Nights (HHN) takes place? Let's a take a look at the HHN 31 data from 2022 to find out. At Universal Studios Florida, where HHN is held, the average wait time in 2022 on days with a HHN event was 32.5 minutes. On days without an event, the average wait time dropped down to 27.4 minutes. Wait times, in general, increased from the beginning of September to the middle of October. Wait times before 5 PM were not much different in October of last year, with week days a bit ligher. Patterns changed on HHN days after 5 PM. Overall, the data suggests there is no real advantage to visiting Universal Studios Florida on a day with HHN in terms of wait times when you get less time in the park (assuming you are not going to HHN). How does HHN affect wait times at Islands of Adventure? On HHN event days at its neighbor park, IOA had an average wait time of 28.1 minutes in 2022. When there was no HHN event next door, the average wait time was down to 23.5 minutes. Some of this difference can be explained by the majority of HHN event days occurring on the busier weekend days for the park. Another factor is more guests choosing to visit IOA on HHN days to take advantage of longer operating hours.
-
How wait times ebbed and flowed around the Magic Kingdom today
-
Should You Visit the Magic Kingdom on a Halloween Party Day?
Webmaster posted a blog entry in Data Bytes
If you are planning to visit the Magic Kingdom at Walt Disney World over the next couple months, you will run into days where the park closes at 6 PM for the separately ticketed event, Mickey's Not-So-Scary Halloween Party (MNSSHP). Events are typically held each Tuesday, Friday, and Sunday. On these days, the park is typically open for 10 operating hours (8:00 AM to 6:00 PM) compared to 13 hours on a typical day (9:00 AM to 10:00 PM), and does not feature a fireworks show (assuming you are not attending MNSSHP). Guests with only a MNSSHP ticket can enter the park beginning at 4:00 PM. But is there a key advantage to visiting on a Halloween Party day? Let's take a look at the wait time data to find out. If the wait time data during August through October from 2022 is analyzed and parsed between days with a Halloween Party (Party Day) and no party (Non-Party), the average wait time difference was 11 minutes! That is, on average, if you visited on a day with a Mickey's Not-So-Scary Halloween Party event, with a daily average wait time of 24.4 minutes, your average wait time was 11 minutes lower than a non-party day, with a daily average wait time of 35.4 minutes. The same data is illustrated below for the 2022 series of MNSSHP. Note that this data is only from the operating day and not the Halloween Party event itself. For event averages see, the MNSSHP page. 2022 MNSSHP Day vs Non-Party Day Wait Times Notice, too, that wait times last year increased over time, beginning in late September through mid-October, but that Halloween Party days still had considerably lower wait times than non-party days. In August, the average party day wait time was 19.8 minutes, in September it was 20.1 minutes, and in October it was 28.6 minutes. This data suggests that visiting on a MNSSHP day in August or September is your best bet for lower wait times at the Magic Kingdom. MNSSHP is underway in 2023 too. How have wait times looked so far (through three events)? The average for Halloween Party days is 20.0 minutes while for non-party days it is 28.1 minutes, a difference of 8.1 minutes. Not as big of gap as seen in 2022 so far, but the data set is limited. But the trend continues that wait times are lower on MNSSHP days. This graph will be updated as more events occur. 2023 MNSSHP Day vs Non-Party Day Wait Times The average wait time on a non-party day in 2023 is 27.7 minutes compared to 18.3 minutes on a MNSSHP day, a difference of over 8 minutes! If you do not mind a few less operating hours (the park does open earlier, and earlier leads to lower wait times in general any day), and no fireworks show/park experiences at night, visiting on a day with a Mickey's Not-So-Scary Halloween Party event should offer lower wait times across the Magic Kingdom. One final graph: can you pick out which days were party days just based on the wait time profiles from August last year within a one week time frame? Genie+ Pricing Differences Some interesting trends have appeared with Genie+ pricing between Halloween Party days and non-party days. During each MNSSHP event so far, the price for Genie+ at the Magic Kingdom has been $25 per person. With the lower crowds during the day (shorter operating hours), this is a bit expensive, and the price really should be $23 per person or less. This week, a new trend began for the non-party days. Monday (8/21), Wednesday (8/23), and Thursday (8/24) have featured a Magic Kingdom Genie+ price of $27 per person. So on non-party days, you are now pay a premium for the higher crowd levels, and on party days you are also paying too much for the crowd levels. It will be interesting to see if this trend continues. 8/11/23: Price: $25, average wait: 20 minutes 8/12/23: Price: $25, average wait: 27 minutes 8/13/23: Price: $25, average wait: 23 minutes 8/14/23: Price: $25, average wait: 31 minutes 8/15/23: Price: $25, average wait: 18 minutes 8/16/23: Price: $25, average wait: 32 minutes 8/17/23: Price: $25, average wait: 29 minutes 8/18/23: Price: $25, average wait: 22 minutes 8/19/23: Price: $23, average wait: 27 minutes 8/20/23: Price: $23, average wait: 23 minutes 8/21/23: Price: $27, average wait: 31 minutes 8/22/23: Price: $25, average wait: 22 minutes 8/23/23: Price: $27, average wait: 33 minutes -
Several reported waits by users today compared to the posted wait times Buzz Lightyear's Space Ranger Spin Posted Wait: 25 minutes User Reported Wait: 12 minutes Pirates of the Caribbean Posted Wait: 45 minutes User Reported Wait: 25 minutes The Magic Carpets of Aladdin Posted Wait: 25 minutes User Reported Wait: 19 minutes Pirates of the Caribbean Posted Wait: 55 minutes User Reported Wait: 21 minutes Jungle Cruise Posted Wait: 65 minutes User Reported Wait: 7 minutes "it's a small world" Posted Wait: 45 minutes User Reported Wait: 3 minutes Prince Charming Regal Carrousel Posted Wait: 15 minutes User Reported Wait: 1 minutes Dumbo the Flying Elephant Posted Wait: 40 minutes User Reported Wait: 32 minutes Under the Sea ~ Journey of The Little Mermaid Posted Wait: 5 minutes User Reported Wait: 0 minutes Mad Tea Party Posted Wait: 10 minutes User Reported Wait: 0 minutes Under the Sea ~ Journey of The Little Mermaid Posted Wait: 15 minutes User Reported Wait: 18 minutes Enchanted Tales with Belle Posted Wait: 25 minutes User Reported Wait: 28 minutes The Barnstormer Posted Wait: 30 minutes User Reported Wait: 6 minutes
-
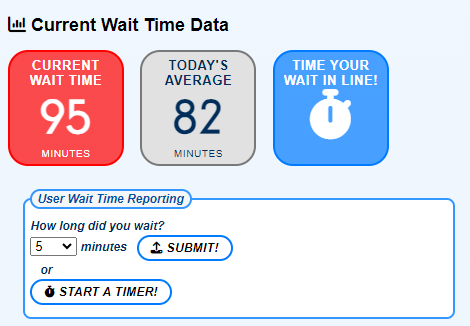
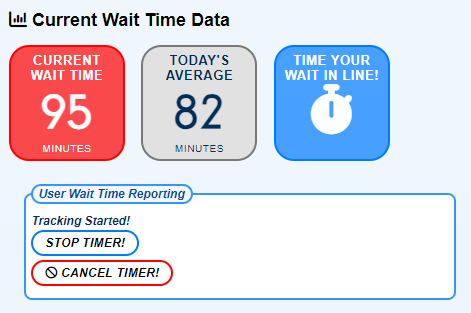
We've added the ability to cancel a wait timer in progress. First, you need to start a timer on an attraction with the Start a Timer button. Once a timer has started, on the attraction's page, click the button for Cancel Timer. This will delete the timer completely. Encounter any issues? Please let us know!
-
This week (8/14 to 8/20/2023), wait times across Walt Disney World were the same as compared to last week, with an average wait time of 33 minutes (last week was down 3 minutes compared to the previous week, for reference). Out of the past 85 weeks, this week would rank #72. The same week last year ranks #61 with an average wait time of 35 minutes. It is definitely at the start of the slower season, but that doesn't mean there are no crowds. Disney World daily average wait times the past month. A pattern of a slow weekend with a busy Monday just about every week. Daily wait time profiles were pretty consistent throughout the week. Sundays remained a low day too. Disney's Animal Kingdom At DAK, Avatar Flight of Passage led the way with an 85 minute average wait time, followed closely behind by Navi River Journey at 76 minutes. Wait times were higher this past weekend than most of the weekdays. Overall, wait times were down 1 minute compared to last week, park wide. Lightning Lane availability was good, with everything at least lasting into the early afternoon. EPCOT At EPCOT, Test Track and Frozen Ever After had the highest average wait time at 71 minutes, follow by Remy's Ratatouille Adventure at just over an hour. Overall, wait times were down 2 minutes compared to last week, park wide. Lightning Lane slots became tough to get for the 3 major Genie+ options just into the afternoon. Snag Test Track first you if have to make a choice. Disney's Hollywood Studios At DHS, Slinky Dog Dash continues to have high wait times, averaging a 99 minute wait the past week. This was 25 minutes higher than Rise of the Resistance, which has waned some in popularity (Is ROTR Too Expensive?). Overall, wait times were up 1 minute compared to last week, park wide. If you want to ride Slink Dog Dash, grab a Lightning lane at 7 AM. It has been selling out very quickly. Everything else is lasting into the afternoon. The Magic Kingdom At the Magic Kingdom, you know have two distinct patterns: Halloween Party days and non-party days. If you visit on a party day, expect well below average crowds before 4 PM (but the park does close at 6 PM and you will not get fireworks). Party days are typically each Tuesday, Friday, and Sunday. This leads to the non-party days being busier though. Seven Dwarfs Mine Train and Peter Pan's Flight had the highest average wait times, both at or above 70 minutes. Overall, wait times were down 2 minutes compared to last week, park wide. Lightning Lane availability last week was very good. On party days, Genie+ is probably not worth it if you are trying to cut costs as it has been expensive relative to the crowd levels. Genie+ prices were maxed at $25 during the week last week, only dropping on the weekend.
-
The Effects of Hurricane Hilary on Disneyland Wait Times
Webmaster posted a blog entry in Data Bytes
Disneyland Resort is feeling the effects of now Tropical Storm Hilary. Wait times at both parks are well below average, and the lowest in years. Rise of the Resistance is the only attraction averaging more than an hour wait time. Resort wide, today ranks #596 out the past 596 days! Wait times are lower than the park when it first return in April 2021 from COVID closures. Going back to 2019, wait times today at Disneyland rank #1190 out of 1190! -

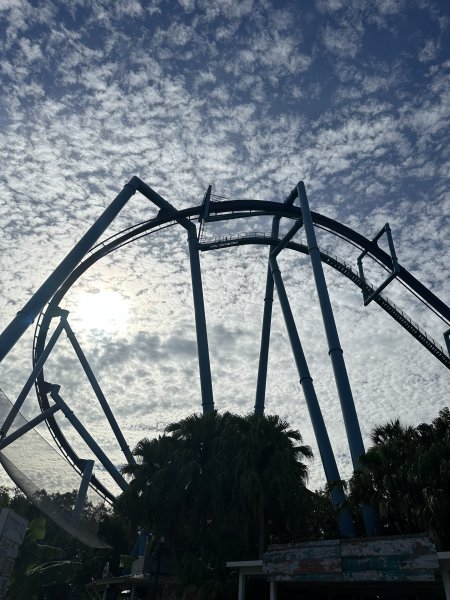
From the album: SeaWorld Orlando
Mako at SeaWorld Orlando -
-
-

From the album: SeaWorld Orlando
-

From the album: SeaWorld Orlando
-

From the album: SeaWorld Orlando
-

From the album: SeaWorld Orlando
-

From the album: SeaWorld Orlando
-

From the album: SeaWorld Orlando
-

From the album: SeaWorld Orlando
-

From the album: SeaWorld Orlando
-

From the album: SeaWorld Orlando
-

From the album: SeaWorld Orlando
-

From the album: SeaWorld Orlando
-

From the album: SeaWorld Orlando
.png.b1608b9a8d1dec1b108a9c32108e3ee1.png)
.png.e40d4ae2e7fbf12a432965022cd57832.png)
.png.a61eb0bf77dea24c48bec3fa41932e14.png)
.png.47fb94feed9ca8ec9256c6e593f6d57e.png)
.gif.7e737c8fdee3dfa233ff55cb5c87259c.gif)