Webmaster
-
Posts
1,478 -
Joined
-
Last visited
-
Days Won
24
Content Type
Profiles
Forums
Gallery
Events
How-To
Blogs
Everything posted by Webmaster
-
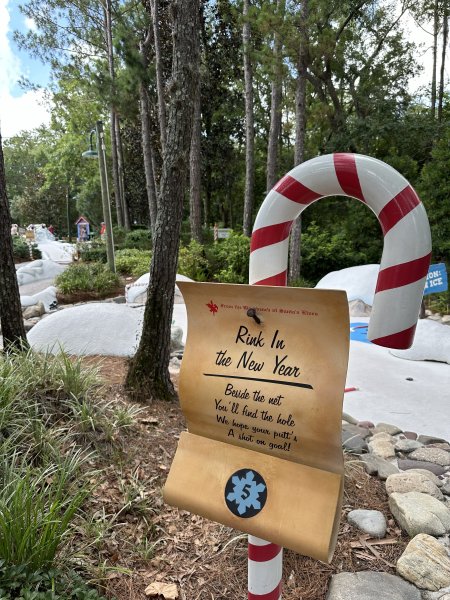
From the album: Winter Summerland
-
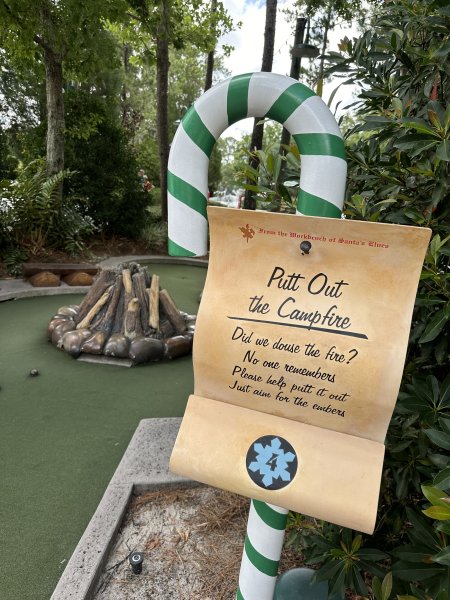
From the album: Winter Summerland
-
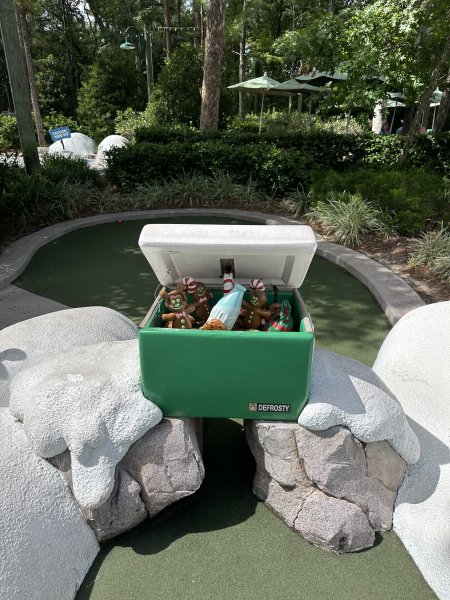
From the album: Winter Summerland
-
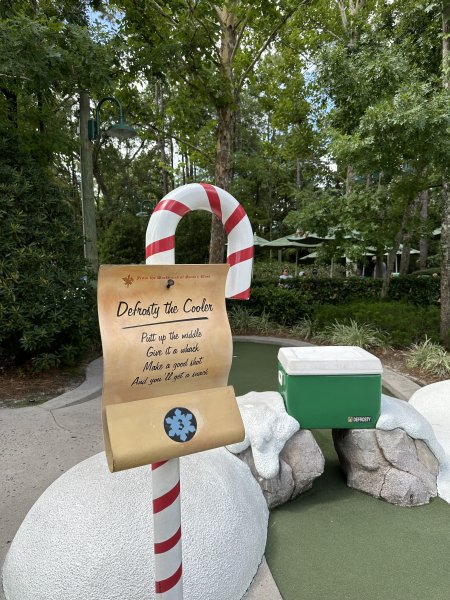
From the album: Winter Summerland
-
From the album: Winter Summerland
-

From the album: Winter Summerland
-

From the album: Winter Summerland
-
Six months down, and six more to go in 2024: we are officially half-way through the year! How do wait times across Walt Disney World Resort compare to previous years up to this point? We dive into the data to find out! Resort wide, the pinnacle of post-pandemic travel was in winter and spring of 2022. Demand was very high coming out of a couple vacationless years for many (often referred to as the "revenge travel" period). January has had higher wait times the past two years than 2022 and before the pandemic in 2019. Spring break season in March is down quite a bit the past couple years as well, and June of this year saw more mild wait times than in the past. Across the resort, wait times, on average, have been their lowest on Wednesdays through the first half of the year at an average wait time of 35 minutes with Mondays having the highest average wait time of 39 minutes. This does vary park-to-park, which is detailed further down the article. The Magic Kingdom 01/01/2019 to 06/30/2019 | 01/01/2022 to 06/30/2022 | 01/01/2023 to 06/30/2023 | 01/01/2024 to 06/30/2024 At the Magic Kingdom, average wait times for the first half of 2024 trended below each of the other years in the analysis by as much as 23%. Keep in mind that TRON Lightcycle / Run does not contribute to the average since it is Virtual Queue only (same for Tiana's Bayou Adventure, but that just opened June 28th). Even in the busy 2022, pre-pandemic wait time levels were not observed, partly due to the reservations system. Magic Kingdom Date Range: 01/01/2024 to 06/30/2024 vs: Magic Kingdom Date Range: 01/01/2019 to 06/30/2019: Difference of -8.0 min / -23.4% Magic Kingdom Date Range: 01/01/2022 to 06/30/2022: Difference of -7.6 min / -22.0% Magic Kingdom Date Range: 01/01/2023 to 06/30/2023: Difference of -2.4 min / -8.4% So far in 2024, Tuesdays and Wednesdays are leading the way in terms of highest average wait time at the Magic Kingdom. Weekends have been the days to visit to see lower wait times. The busiest individual days at the Magic Kingdom in the first half of the aligned primarily with holiday periods and with different spring break weeks for areas across the US. The first week of January was busier than some years thanks to how the holiday period setup in December of 2023, leading to more breaks being extended into 2024 (including the local Orange County). Most months through June 2024, Seven Dwarfs Mine Train averaged the highest wait time across the Magic Kingdom. March wait times averages, with the highest average of the first half, is shown below. Peter Pan's Flight, Jungle Cruise, and Space Mountain typically were the other highest wait times, on average. During the peak spring break season, Lightning Lane availability across the Magic Kingdom was decent. The table below is sorted based on the monthly average time at which Lightning Lane reached capacity. Earlier in the day is considered worse from a guest perspective, and is indicated in red or orange. Green means that the Lightning Lane for an attraction could still be obtained late in the afternoon. The two Individual Lightning Lane attractions, Seven Dwarfs Mine Train and TRON Lightcycle / Run, reached capacity first, on average. This data is useful to help set priorities during busy periods, but will change with the introduction of Lightning Lane Multiple Pass on July 24th. Also, since debuting at the end of June, Tiana's Bayou Adventure is now the first to reach capacity. Disney's Animal Kingdom 01/01/2019 to 06/30/2019 | 01/01/2022 to 06/30/2022 | 01/01/2023 to 06/30/2023 | 01/01/2024 to 06/30/2024 Through six months, average wait times across Disney's Animal Kingdom were just about flat with 2023, but lower than 2022 and 2019. Before the pandemic, Avatar Flight of Passage was newer and often averaged a 2 hour wait time (or often much more), leading to a higher park average overall. Animal Kingdom Date Range: 01/01/2024 to 06/30/2024 vs: Animal Kingdom Date Range: 01/01/2019 to 06/30/2019: Difference of -11.6 min / -24.2% Animal Kingdom Date Range: 01/01/2022 to 06/30/2022: Difference of -2.7 min / -6.8% Animal Kingdom Date Range: 01/01/2023 to 06/30/2023: Difference of -0.3 min / -0.8% If you are looking for the best day to visit Disney's Animal Kingdom, through the first half of 2024, Wednesday are your best bet. Mondays, Fridays, and Saturdays tend to have higher average wait times. February featured wait times on the higher end for Animal Kingdom. President's Day weekend and the winter break that follows is typically busy, but overall averages were high for most of the month. The winter is one of the few months in which you can see Pandora in all of its nighttime glory too. In terms of Lightning Lane availability, during the busy spring break season, Avatar Flight of Passage typically reached capacity first followed by meeting Mickey and Minnie. The good news, if you miss the initial distribution for Flight of Passage, is that it typically replenishes several times a day. Disney's Hollywood Studios 01/01/2019 to 06/30/2019 | 01/01/2022 to 06/30/2022 | 01/01/2023 to 06/30/2023 | 01/01/2024 to 06/30/2024 Average wait times across Disney's Hollywood Studios were higher than before the pandemic by about 6% for the first half of the year. But they were nearly 20% lower than the peaks seen during 2022. Hollywood Studios Date Range: 01/01/2024 to 06/30/2024 vs: Hollywood Studios Date Range: 01/01/2019 to 06/30/2019: Difference of 2.4 min / 6.4% Hollywood Studios Date Range: 01/01/2022 to 06/30/2022: Difference of -9.5 min / -19.2% Hollywood Studios Date Range: 01/01/2023 to 06/30/2023: Difference of -3.0 min / -7.0% Disney's Hollywood Studios had three distinctly busier days in Mondays, Thursdays, and Fridays during the first six months of 2024, with lighter days on Sundays and Wednesdays. During the peak spring break season, the highest wait times, on average, across Hollywood Studios were for Slinky Dog Dash and Star Wars: Rise of the Resistance, averaging wait times close to two hours. Smuggler's Run, Tower of Terror, and Runaway Railway also averaged over an hour wait. Disney's Hollywood Studios is home to one of the most difficult Lightning Lanes to obtain: Slinky Dog Dash. During busy periods, such as the spring break season of 2024, it typically reaches capacity within a few minutes. It should be your #1 priority if you hope to obtain a Lightning Lane. The Individual Lightning Lane for Rise of the Resistance is generally also a hot commodity, often reaching capacity in the morning hours. EPCOT 01/01/2019 to 06/30/2019 | 01/01/2022 to 06/30/2022 | 01/01/2023 to 06/30/2023 | 01/01/2024 to 06/30/2024 With its newer attractions, recent updates, and festivals, EPCOT has seen a growth in its average wait times in 2024 of at least 4.5% compared to 2019, 2022, and 2023. In particular, Guardians of the Galaxy: Cosmic Rewind (whose Virtual Queue typically fills in seconds still) and Remy's Ratatouille Adventure remain incredibly popular attractions across the entire resort. EPCOT Date Range: 01/01/2024 to 06/30/2024 vs: EPCOT Date Range: 01/01/2019 to 06/30/2019: Difference of 4.5 min / 15.4% EPCOT Date Range: 01/01/2022 to 06/30/2022: Difference of 1.5 min / 4.6% EPCOT Date Range: 01/01/2023 to 06/30/2023: Difference of 2.4 min / 7.8% EPCOT tended to be busiest on Mondays, but, unlike the other WDW parks, is pretty popular still on Saturdays and Sundays. Locals often visiting on the weekend to partake in the festivals being offered. Wait time wise, during busy periods in the first half of the year, Frozen Ever After and Remy's Ratatouille Adventure drew the biggest crowds with average wait times over 80 minutes. Guardians of the Galaxy: Cosmic Rewind utilizes the Virtual Queue, but once a boarding group is redeemed, wait times do often exceed an hour or more. In terms of Lightning Lane, EPCOT has a "big three" attractions that are a part of Genie+/Lightning Lane Multi Pass that are high in demand: Remy's Ratatouille Adventure, Frozen Ever After, and Test Track. It is often very difficult to obtain two or three of these attractions. The good news is that is a somewhat consistent pattern to additional availability for these. Cosmic Rewind, as an Individual Lightning Lane, often is too, especially during holiday periods. Note that Test Track is now closed for refurbishment. Overall, wait times were a bit lower across Walt Disney World through the first half of 2024 than the past couple years. EPCOT is the one exception where average wait times are up. Big changes are on the way with Lightning Lane Multi Pass and Single Pass allowing pre-trip selections. It will interesting to see how those changes affect the data for the rest of the year!
-
Wait times in June 2024 were down an average of 3 minutes compared to last June at Cedar Point. June 2024 vs: Average Wait: Difference of -0.1 min / -0.2% June 2019: Difference of -1.4 min / -5.6% June 2022: Difference of 3.0 min / 13.8% June 2023: Difference of -3.3 min / -11.8%

-
Summer arrived last month at Universal Orlando Resort with intense heat and the stormy season began. What were wait times like, how did they compare to the past, and what were the lightest & busiest days to go at Universal Orlando Resort? Lets take a look at the data to find out! A resort-wide view of the daily average wait times shows a slight upward trend in wait times over the course of the month. Overall, wait times were up 2 minutes over May, but still the 2nd lowest, based on monthly average, for the year. Islands of Adventure At IOA, wait times were down 2 minutes from June of 2023, during peak hours, but slightly up from pre-pandemic in 2019. On a per ride basis, it is noticeable that VelociCoaster wait times have gotten lower, but Hagrid has stayed pretty constant. Typically, Mondays and Saturdays had the highest wait times with slower days on Tuesdays and Sundays. Comparisons to past Junes: June 2024 vs: Average Wait: Difference of -4.0 min / -13.2% June 2019: Difference of 1.7 min / 7.2% June 2021: Difference of -5.9 min / -19.4% June 2022: Difference of -7.6 min / -23.6% June 2023: Difference of -3.0 min / -11.0% Universal Studios Florida At Universal Studios, June wait times were down 6 minutes from last year during peak hours, with most attractions featuring a lower average than the year prior. DreamWorks Land did open and help contribute by adding new experiences to lower the overall average. In general, Mondays and Saturdays have higher wait times than the other days of the week. Comparisons to past Junes: June 2024 vs: Average Wait: Difference of -3.7 min / -12.6% June 2019: Difference of -1.1 min / -4.6% June 2021: Difference of -7.5 min / -25.0% June 2022: Difference of -7.7 min / -25.2% June 2023: Difference of -2.4 min / -9.4%
-
June has come and gone across Disneyland Resort in 2024. What were wait times like, how did they compare to the past, how was Lightning Lane availability, and what were the lightest & busiest days to go? Lets take a look at the data to find out! A resort-wide view of the daily average wait times shows (above) that typically Mondays and Tuesdays were the busiest days with the highest average wait times. The last three Sundays of the month were particularly light, thanks, in part, to the heat. The monthly average wait time, shown below, was up 1 minute over May of this year, and tied with February at 29 minutes. Disneyland Park At Disneyland, wait times were down 1 minute from June of 2023 during peak hours. As mentioned previously, hotter days tended to keep wait times down, as evidenced by June 23rd in the graph below. When compared to 2019, before the pandemic, wait times this past June were up over 7 minutes on average. Compared to June of 2022, wait times were down 7 minutes. Overall, there was little difference between June '23 and '24 though. June 2024 vs: Average Wait: Difference of -1.2 min / -4.6% June 2019: Difference of 7.5 min / 46.2% June 2022: Difference of -7.0 min / -22.4% June 2023: Difference of -0.1 min / -0.4% When viewed as a calendar, it sticks out that weekends were typically had lower wait times than the weekdays. The highest wait times were typically seen Monday through Wednesday. The spread of wait times was quite high, with a few days reaching average wait times of 45 minutes at their peak while other only hit 20 minutes at peak. Throughout June, Lightning Lane availability was quite good (Genie+ and Individual Lightning Lane) at Disneyland. The graph below shows the percentage of time at each time of the day that Lightning lane was available for a given attraction (green means it was likely available at a given time, red not likely). Most attractions maintained availability up to 3 PM, at which attractions like Indiana Jones, Space Mountain, and the Matterhorn began to reach capacity on some days. Did you know that these attractions often release more Lightning Lane availability at consistent times? We track those here! Disney California Adventure At California Adventure, June wait times were also down 1 minute from last year. Like Disneyland, weekends tended to have shorter wait times than Monday through Wednesday. Throughout June, Lightning Lane availability was quite good (Genie+ and Individual Lightning Lane) at DCA. The graph below shows the percentage of time at each time of the day that Lightning lane was available for a given attraction. Only Mission Breakout was reaching Lightning Lane capacity before the afternoon on some days. More Disneyland Content to Explore Lightning Lane Sell Out Times Magic Key Park Pass Alerts Disneyland Crowd Calendars
-
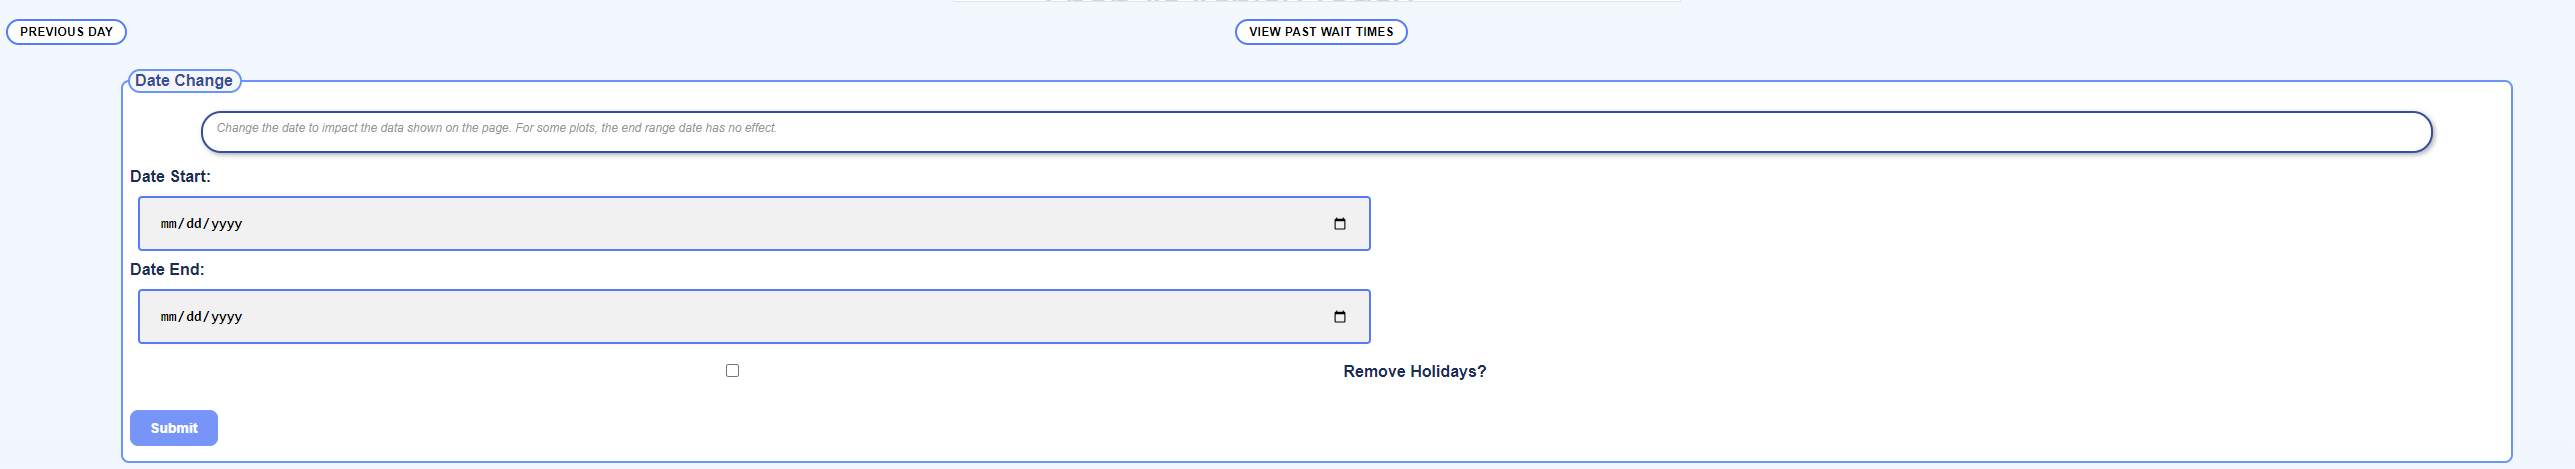
We just offer the past year. Further dates can be viewed via the graphs on the site by clicking the View Past Wait Times button at the top of any park, resort, or attraction page.
-
How have wait times compared in June 2024 to June 2023 across each Walt Disney World theme park? Lets take a look at the data, comparing June 1st to the 26th of each year. This provides a comparison before Tiana's Bayou Adventure opens on June 28th. Magic Kingdom Date Range: 06/01/2024 to 06/26/2024 vs: Average Wait: Difference of -5.2 min / -18.2% Magic Kingdom Date Range: 06/01/2023 to 06/26/2023: Difference of -3.3 min / -12.6% Animal Kingdom Date Range: 06/01/2024 to 06/26/2024 vs: Average Wait: Difference of -4.1 min / -11.0% Animal Kingdom Date Range: 06/01/2023 to 06/26/2023: Difference of -1.4 min / -4.0% EPCOT Date Range: 06/01/2024 to 06/26/2024 vs: Average Wait: Difference of -2.7 min / -8.8% EPCOT Date Range: 06/01/2023 to 06/26/2023: Difference of -2.3 min / -8.4% Hollywood Studios Date Range: 06/01/2024 to 06/26/2024 vs: Average Wait: Difference of -8.7 min / -20.0% Hollywood Studios Date Range: 06/01/2023 to 06/26/2023: Difference of -3.6 min / -10.0% The good news for visitors is that wait times are down across the board, from 4% to nearly 13% depending upon the park. It will be interesting to see how the changes to the Lightning Lane system and the opening of Tiana's Bayou Adventure impact the July numbers. Was it just Disney World seeing the drop? Nope, Islands of Adventure and Universal Studios Florida wait times are also down in the 11+% range too. Islands of Adventure Date Range: 06/01/2024 to 06/26/2024 vs: Average Wait: Difference of -4.5 min / -14.6% Islands of Adventure Date Range: 06/01/2023 to 06/26/2023: Difference of -3.5 min / -12.4% Universal Studios Date Range: 06/01/2024 to 06/26/2024 vs: Average Wait: Difference of -4.1 min / -13.8% Universal Studios Date Range: 06/01/2023 to 06/26/2023: Difference of -2.8 min / -11.0% What might be the cause? Less overall travel demand, more efficient park operations (i.e. better staffing levels), hot weather, and upcoming attraction openings could all be some potential factors.
-
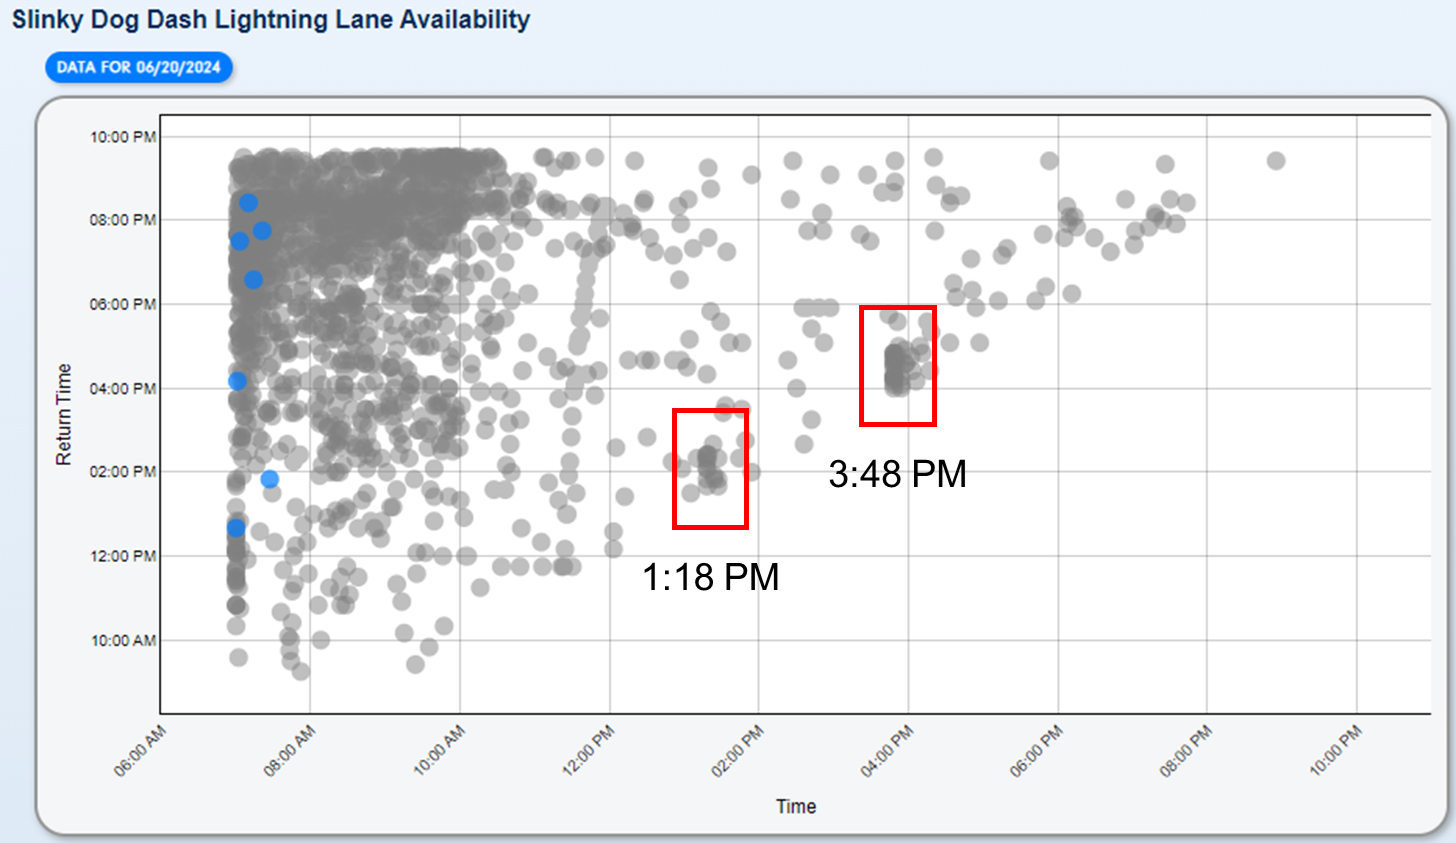
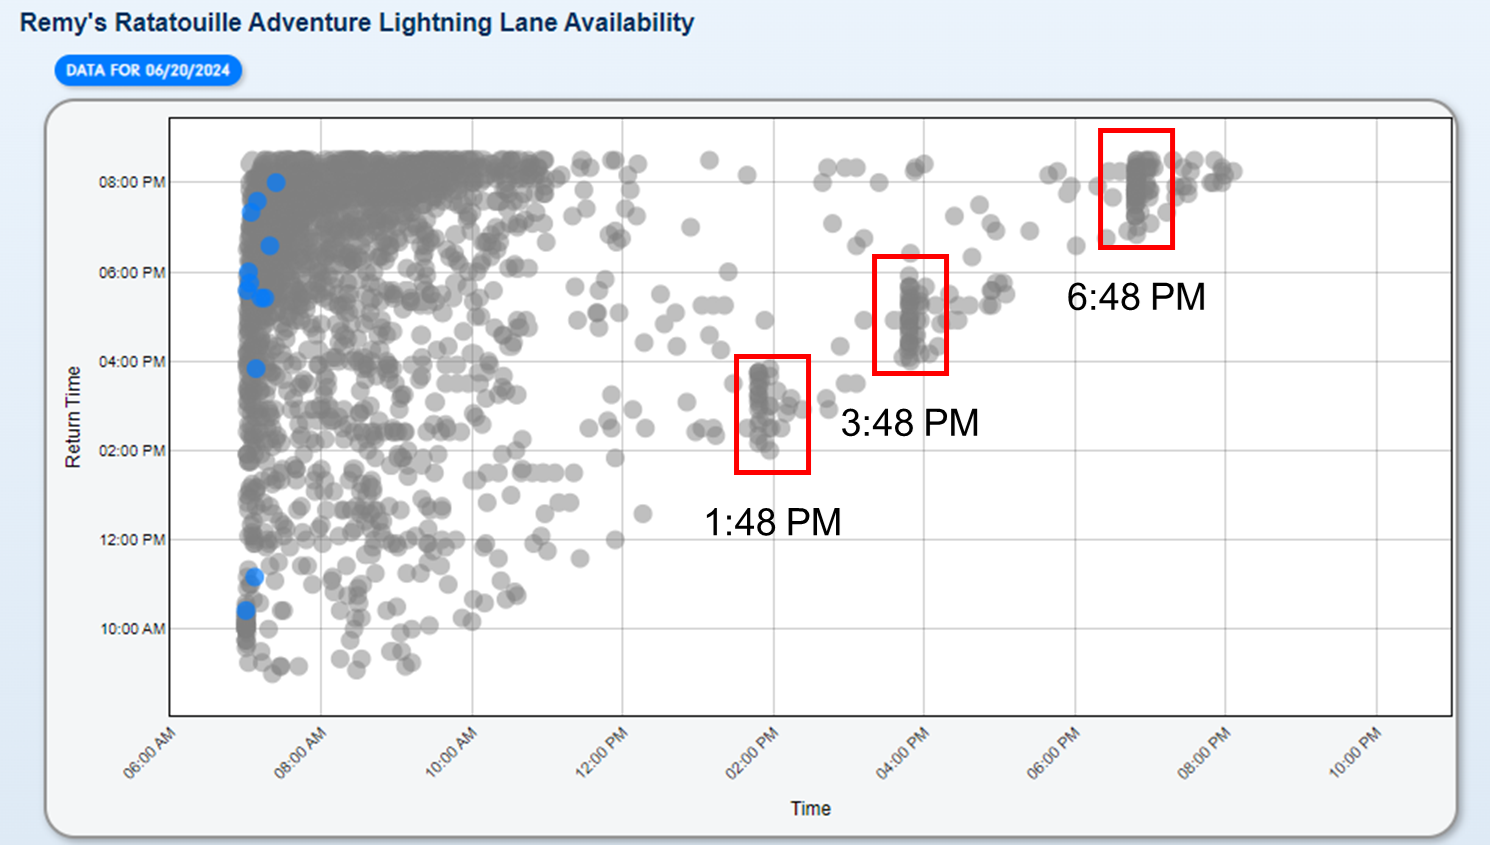
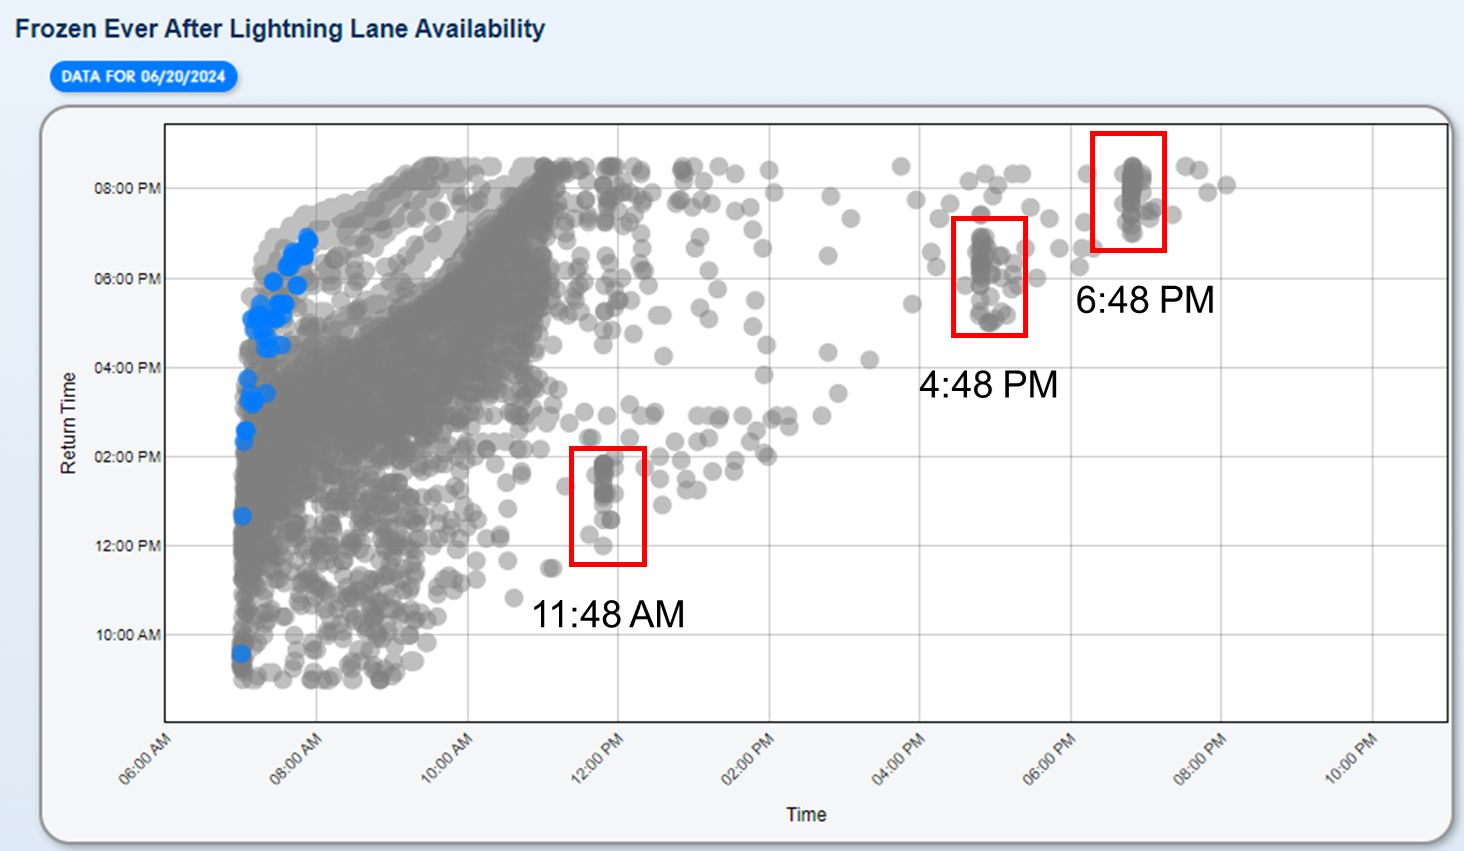
Lets take a look at some recent trends in the Lightning Lane data for some popular WDW attractions. These are situations where Lightning Lane consistently reappears after reaching capacity for the day. Slinky Dog Dash has two possible areas with repeated occurrences: 1:18 PM and 3:48 PM over the past 30 days Remy's Ratatouille Adventure has 3 consistent re-release points lately: 1:48 PM, 3:48 PM, 6:48 PM Frozen Ever After also has 3 consistent re-release points but at 11:48 AM, 3:48 PM, and 6:48 PM. What are your best chances of snagging a slot at these times? Open your tip board and start refreshing a couple minutes before these times. There is no guarantee that Disney will release at this points, but history shows that they often do.
-

Tiana's Bayou Adventure on Genie+
Webmaster replied to Webmaster's topic in Lightning Lane Questions & Discussion/VQ
The first boarding group data should start coming in tomorrow as the AP previews begin. -
Does More Lightning Lane Availability Ever Get Released?
Webmaster commented on Webmaster's blog entry in Data Bytes
It might show up as a correlation in the data over time. Right now, need more data points. -
In a somewhat surprising move, Disney announced that Tiana's Bayou Adventure will be available on Disney Genie+ when it opens next month at Walt Disney World. Most new attractions lately have started with on the Individual Lightning Lane system, providing resort guests an advantage to grab a slot first. On Genie+, any Magic Kingdom guest will be able to book a slot beginning at 7:00 AM.
-
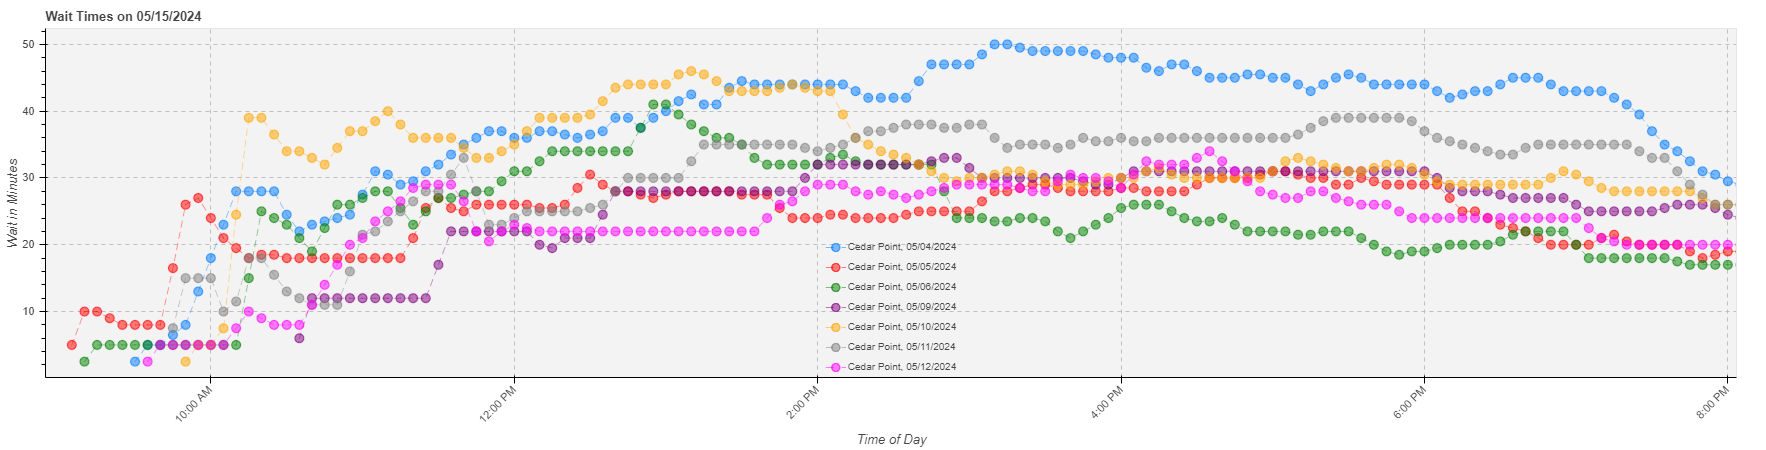
These are the daily average wait times for Cedar Point so far for the 2024 season.
-
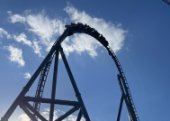
Seems to be something serious. Likely some strain over time developed a more serious issue.
-
Does More Lightning Lane Availability Ever Get Released?
Webmaster posted a blog entry in Data Bytes
A frequently asked question by guests planning to visit the Walt Disney World Resort, often after taking a look at the Lightning Lane capacity/sell out data, is if any additional Lightning Lane slots for both Genie+ and Individual Lightning Lane are released throughout the day? Lets first take a step back to explain what a Lightning Lane "sellout" is. The Lightning Lane, which can be accessed for many attractions through Disney Genie+, and limited attractions through Individual Lightning Lanes, provides a shorter wait time for the attraction booked (for a fee). Each Lightning Lane eligible attraction has a limited number of "slots" or "reservations" that can be booked by Disney World guests on a daily basis through the My Disney Experience app via the Tip Board. The slot denotes a given time period at which the guests can enter the Lightning Lane for an expedited wait for the attraction. Starting when the first Lightning Lane can be booked at 7:00 AM, the allotments of each of these "slots" or "reservations" begin to deplete. For many attractions, just a small amount of the availability is filled at 7:00 AM. However, for some of the more popular attractions, such as Slinky Dog Dash at Disney's Hollywood Studios and Remy's Ratatouille Adventure at EPCOT, a large percentage of the availability is filled within minutes (or even seconds) of 7:00 AM. When all availability for attraction has been filled, it has "sold out" or reached capacity, and the option to reserve a "slot" will disappear from My Disney Experience (i.e. indicates that guests can no longer book a time for the attraction). What time the sell out occurs varies by the day per attraction, but it can be very quick for the biggest attractions at Walt Disney World during busy periods. We track these times each day on this page (example shown above for EPCOT). Often, it is at or around the park opening plus 2 hours mark, which typically aligns with 11:00 AM or before (dependent on the park you are at). So, you've paid for the Genie+ service, but now cannot get a Lightning Lane for the attractions you want? Or you are an off-site guest and the Individual Lightning Lane you wanted sold out before you were eligible to purchase it? What can you do now? There are a couple options: one based on randomness and one based on past occurrences. The latter is your better bet, but back to that in a moment. First, it is possible, that a Lightning Lane slot will randomly open up for the attraction that you want. This happens when other guests modify or cancel their plans, leading to a brief moment of availability. This is not in any way predictable, and requires constantly refreshing the Tip Board in My Disney Experience. This method is often called playing the Disney slot machine. More often than not, you won't get what you want, but may strike the jackpot every once in awhile. Guardians of the Galaxy: Cosmic Rewind is a good example of this behavior. Below is the availability heat map for Cosmic Rewind for a 30 day period. Colors, ranging from green to red to denote the best available return time, indicate that the Individual Lightning Lane was available at a given time of day for the attraction. Gray indicates that it is "sold out" or at capacity. After the continuous color bar ends, within the gray, you can see random spots of color, indicating that Lightning Lane availability briefly appeared. An example is circled in blue in the image below. However, it is evident that there is no apparent pattern to the availability on a day-to-day basis. So is there any predictable release of additional Lightning Lane slots for "sold out" or at capacity attractions? If we take a look at the Lightning Lane availability map instead for Remy's Ratatouille Adventure, there are some noticeable differences compared to Cosmic Rewind previously. As highlighted in the blue circles, there are vertical lines of availability at about the same time of the day for most days within the 30 day span shown. Those are releases of new Lightning Lane availability! Often, the return time is pretty close to the current time too. Over a 60 day period, the same times are even more pronounced, as shown below. The releases appear to occur just before 2:00 PM, 4:00 PM and 5:00 PM. So there are regular releases during a light period across Disney World, but does the same trend hold up over a busy period? Lets take a look at the data! Plotted below is the Lightning Lane data for Remy's Ratatouille Adventure over the 2023/2024 Christmas/New Years holiday period. Between Christmas and New Year's Day is typically the busiest week of the year at Walt Disney World. However, a majority of days still have the same additional releases, especially the two later in the afternoon! What other attractions exhibit this "popup" availability behavior at Disney World? There is a consistent group of five Disney World attractions that exhibit this re-release behavior: Remy's Ratatouille Adventure Test Track Frozen Ever After Avatar Flight of Passage Slinky Dog Dash (this one is more rare during busy periods) At Thrill Data, we automatically check for which attractions exhibit this "popup" behavior and track them conveniently on this page: Popup Lightning Lane Availability. An example from Remy is shown in the figure below: The best strategy is to refresh your Tip Board within My Disney Experience for a few minutes around the times listed on the Popup Availability page. Many users have had success with it! But, be aware that availability is not always released every single day. If the attraction has had issues operating that day, it is less likely that a drop will occur. Why these attractions? Disney would have to answer that, but a common theme is an early "sellout" time and parks with fewer attractions. The Magic Kingdom is absent from this list currently because the number of attractions at the park spreads out Lightning Lane use, leading to "sellout" times later in the day. If you are wondering if the same phenomenon occurs at Disneyland Resort, it does, but it is less common due to overall better Lightning Lane availability at the resort. Disneyland popup availability can be viewed here. Questions? Comments? Success stories? Post them in the comments! -
Sorry, meant President's Day.
-
In quite a few states (Georgia, New York, New Jersey), there is a school winter break during the week of Columbus Day. This week is traditionally very busy. Late February to the beginning of March is usually a bit of a lull with below average wait times. Early February is about average, which means a decent bit of people at the parks (i.e. it will likely feel crowded).
-
We do not currently have a mechanism to do so.
-
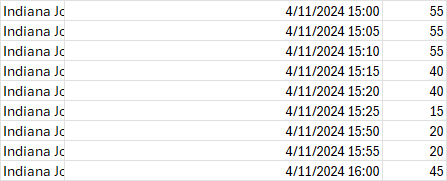
If there is a delay, we stop collecting data. For example, there is a gap in time like this from 3:25 to 3:50:
-
We do not currently have a Linkedin for the site, just the usual socials. We are glad you enjoy the site and we'd love to see your presentation!

.png.375549a1b66d6b069452ad497cd9cad9.png)