Webmaster
-
Posts
1,478 -
Joined
-
Last visited
-
Days Won
24
Content Type
Profiles
Forums
Gallery
Events
How-To
Blogs
Everything posted by Webmaster
-
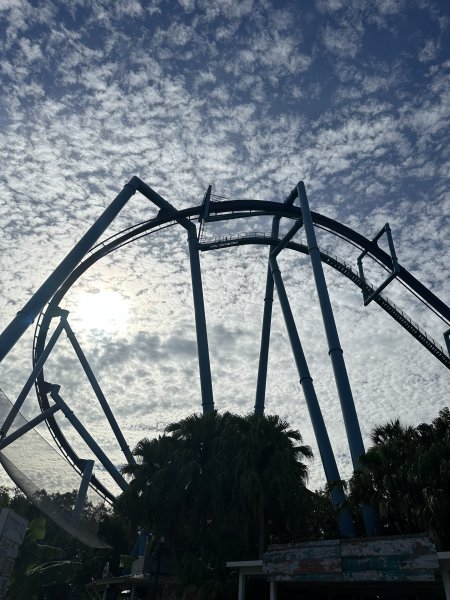
From the album: SeaWorld Orlando
-

From the album: SeaWorld Orlando
-

From the album: SeaWorld Orlando
-
What we did yesterday

-
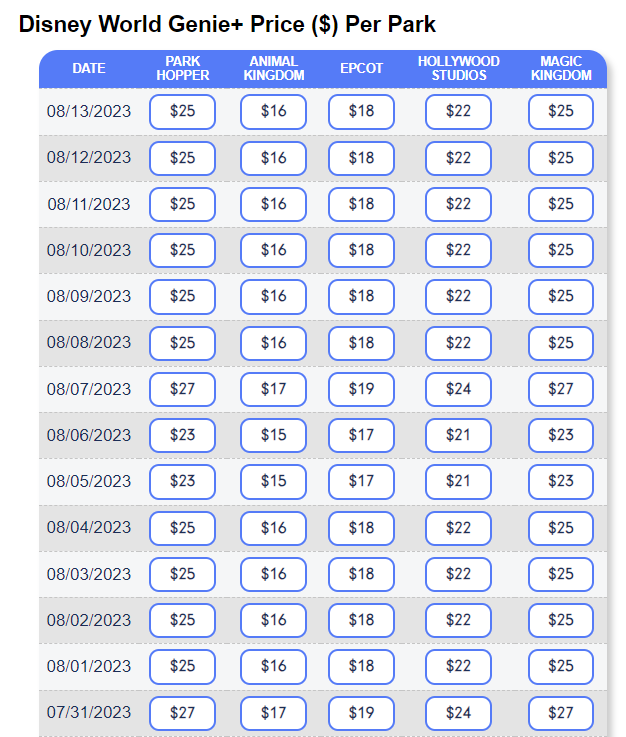
At Walt Disney World, the prices for Genie+ have dropped for the first time in nearly two weeks, down to a maximum of $23 per person. The last time at this price point was August 6th. It has been surprising that the cost at the Magic Kingdom has remained $25 per person on Mickey's Not So Scary Halloween Party days. Crowds have been much lower during the day on which the first 3 events have occurred.
-
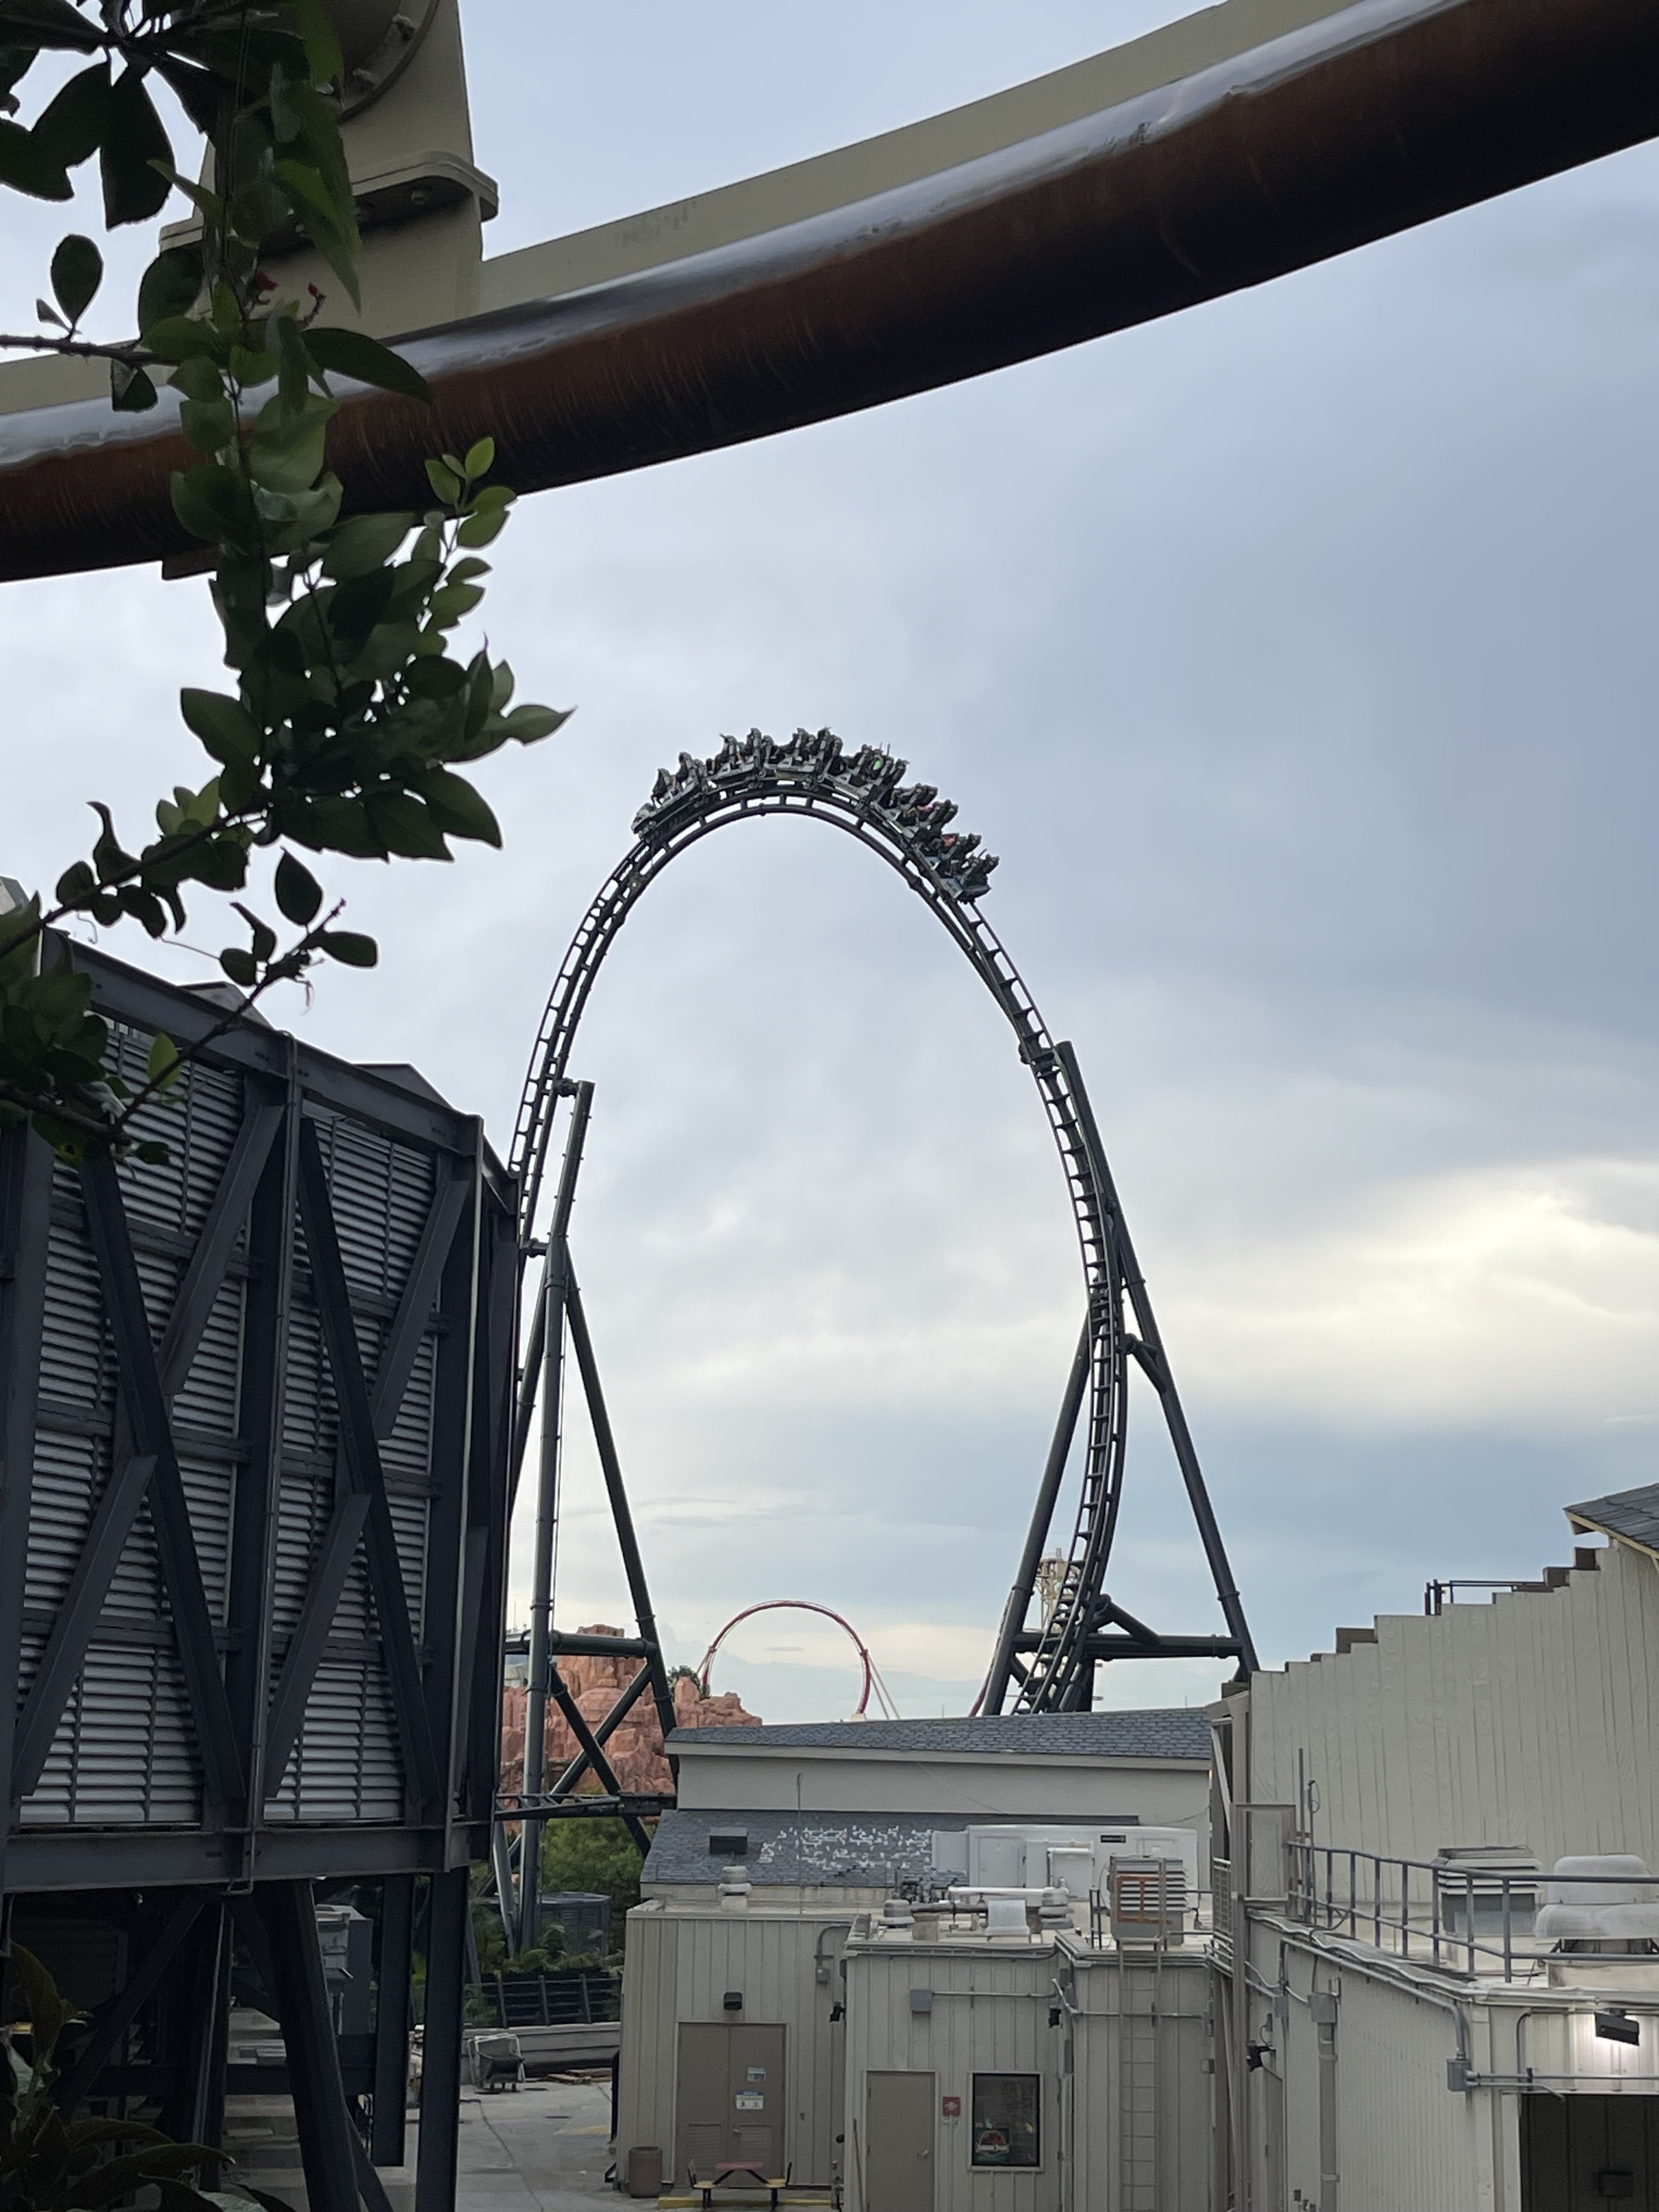
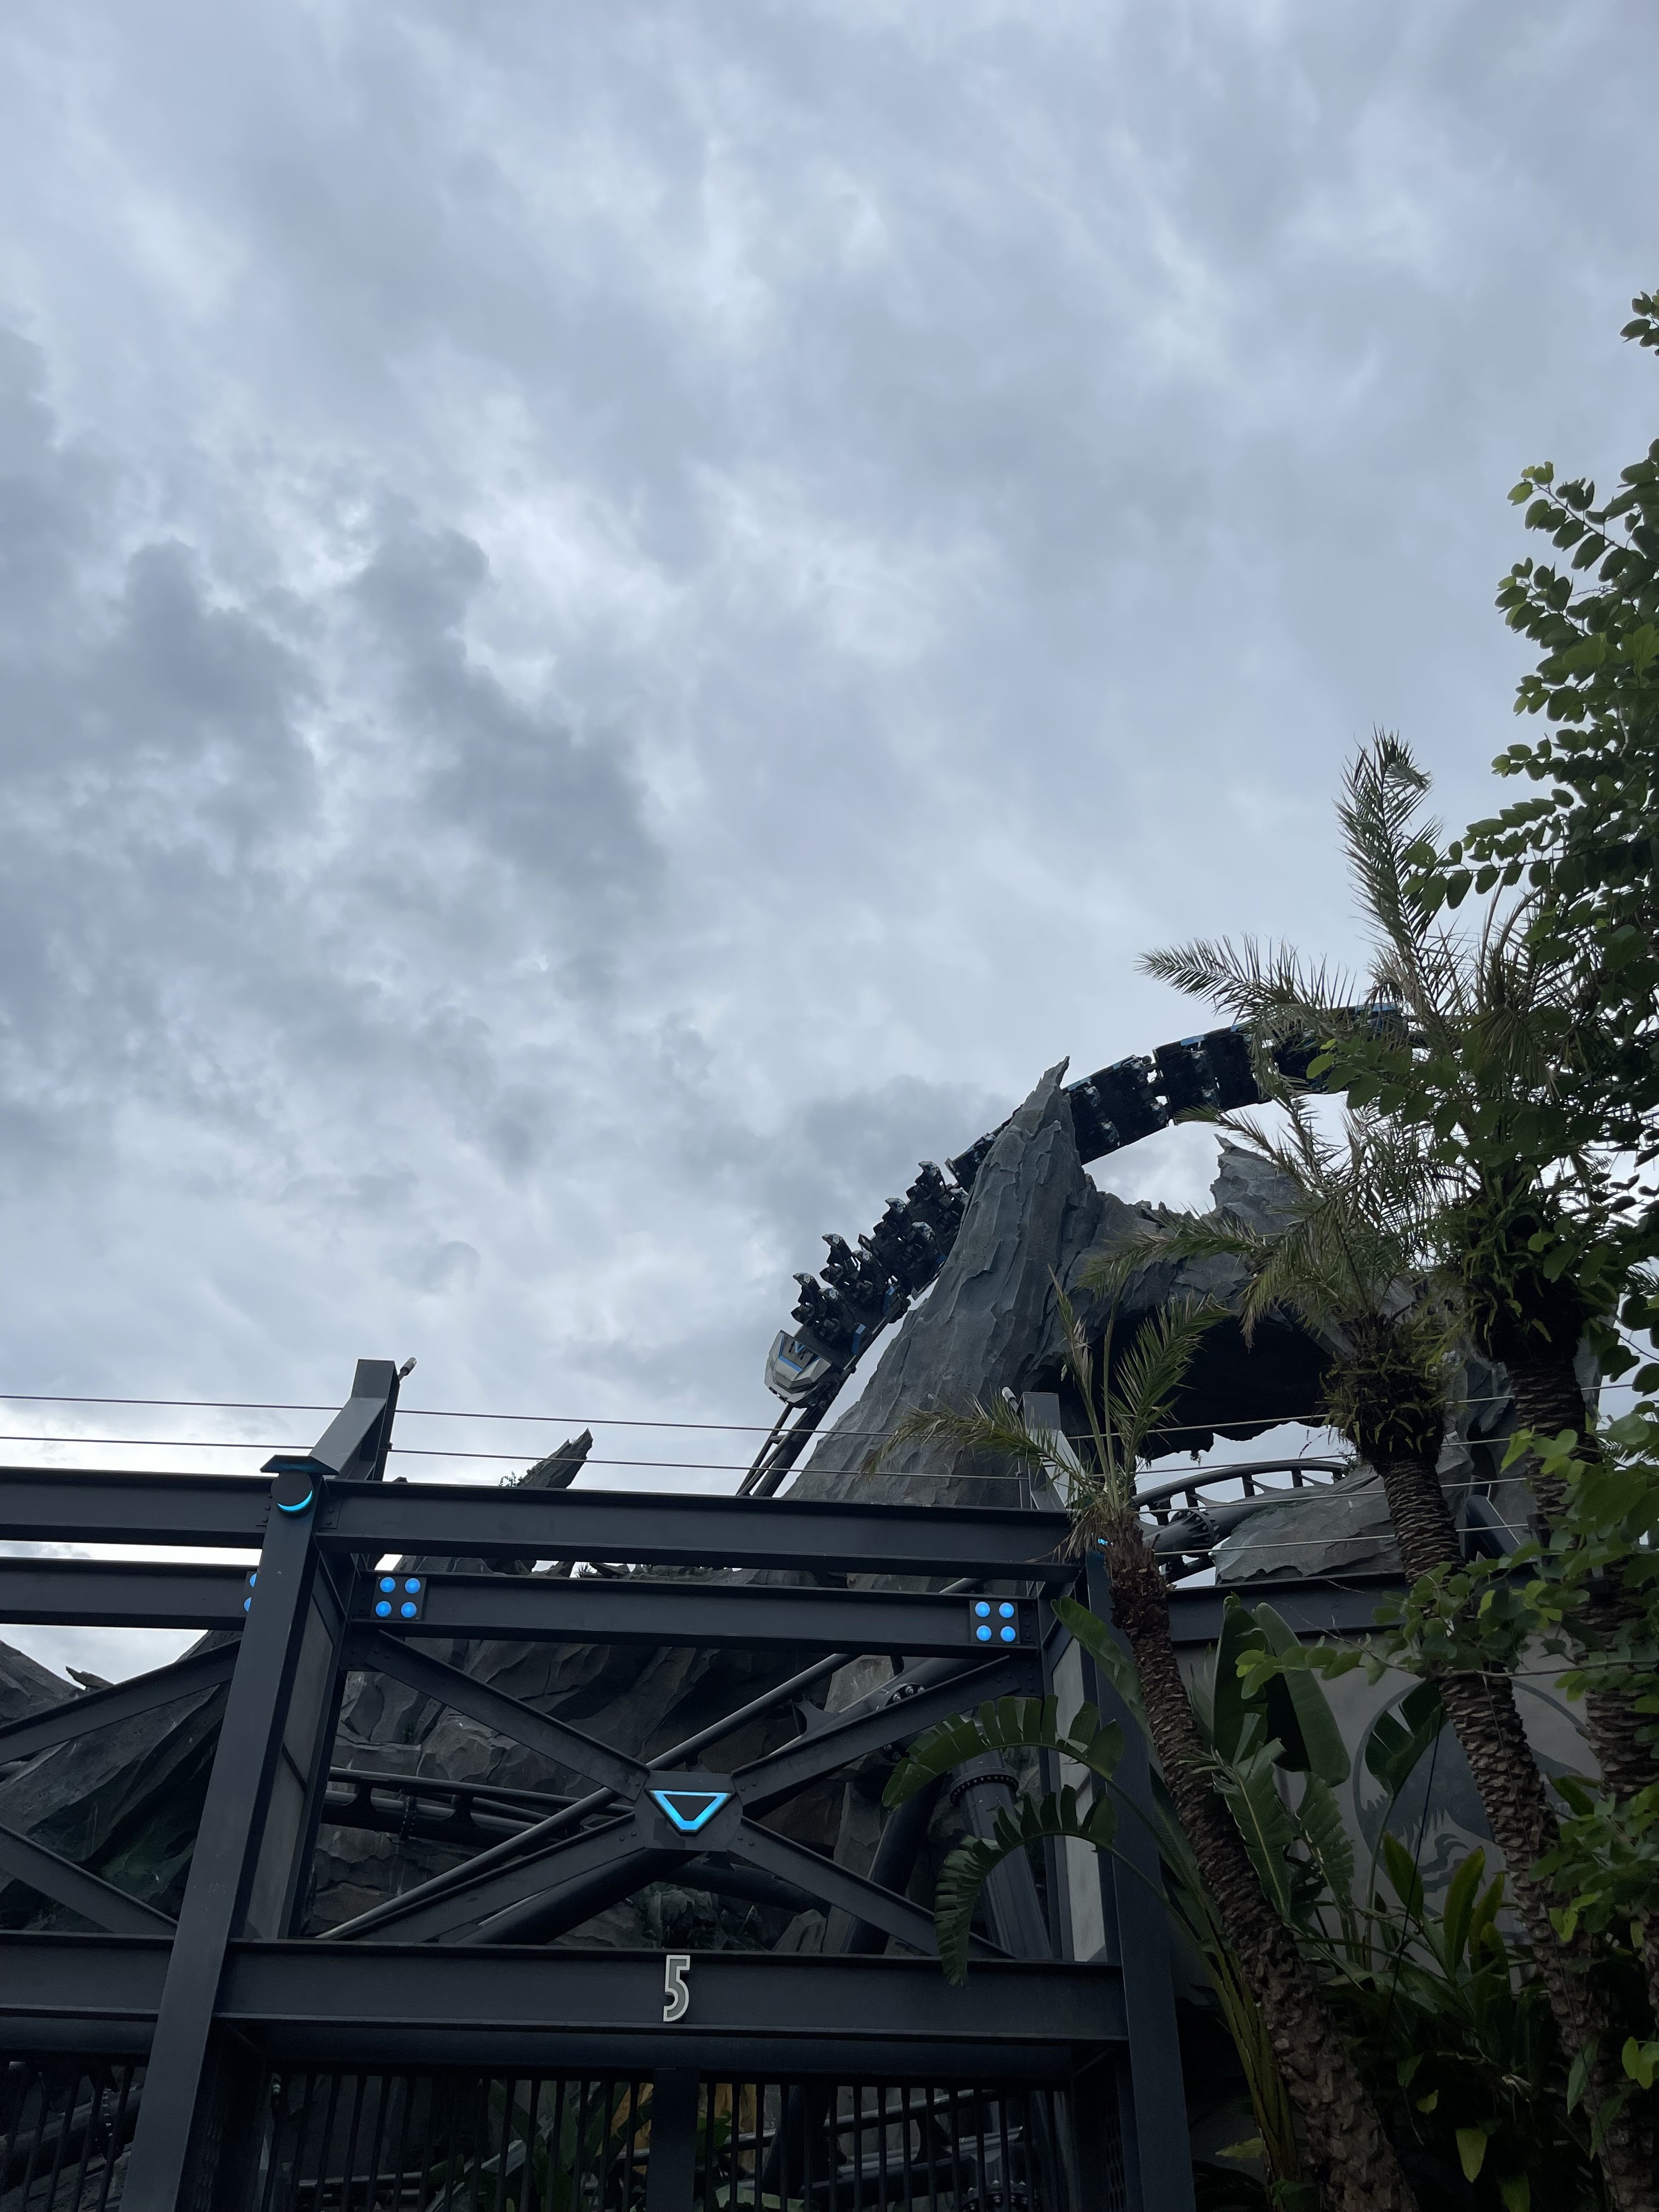
VelociCoaster
-
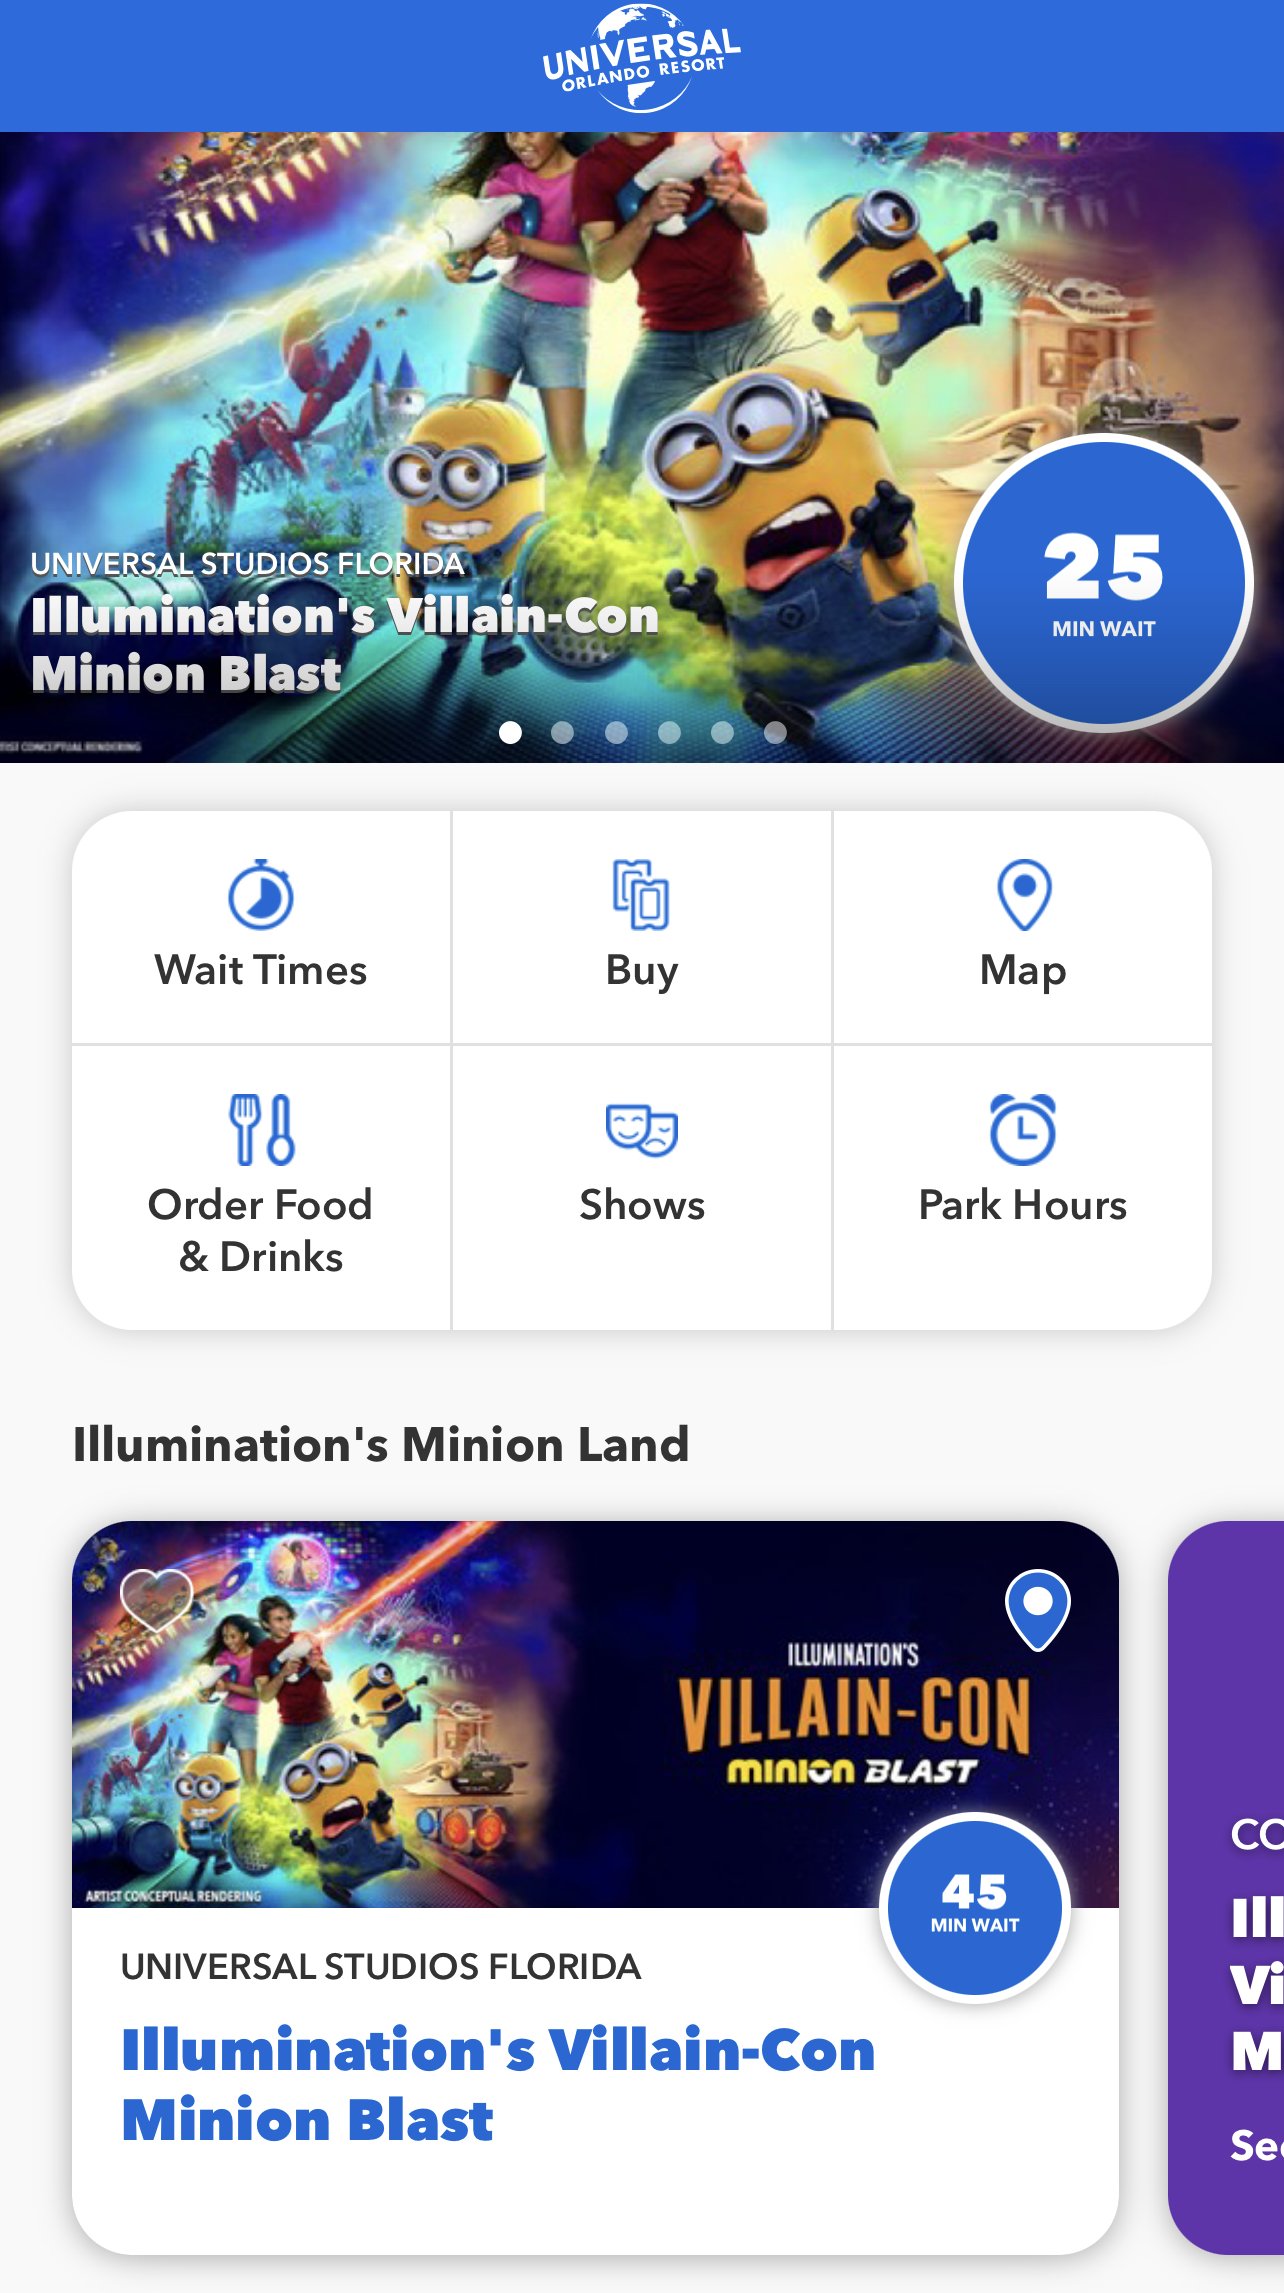
25 minutes or 45 minutes for Villain-Con?
-
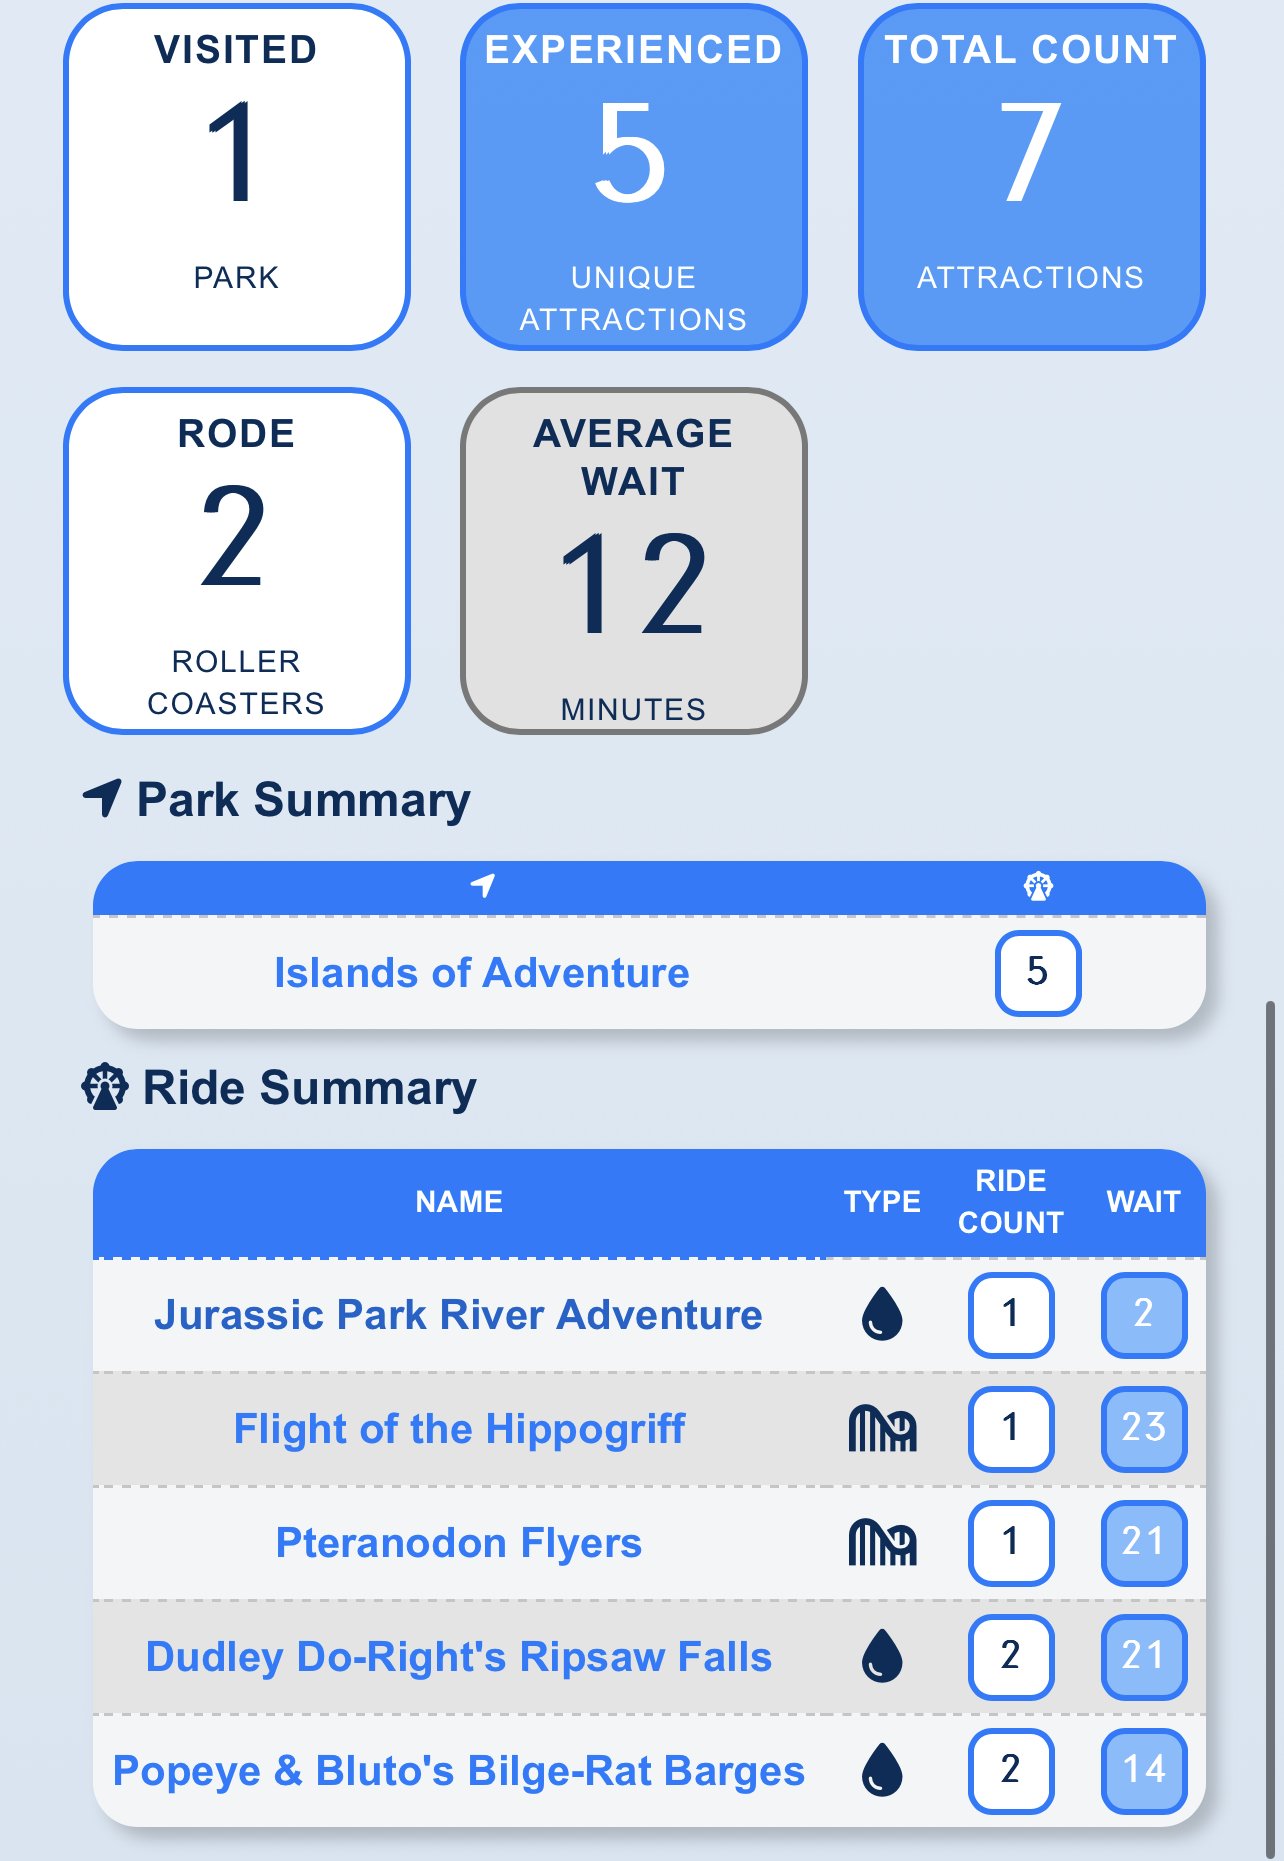
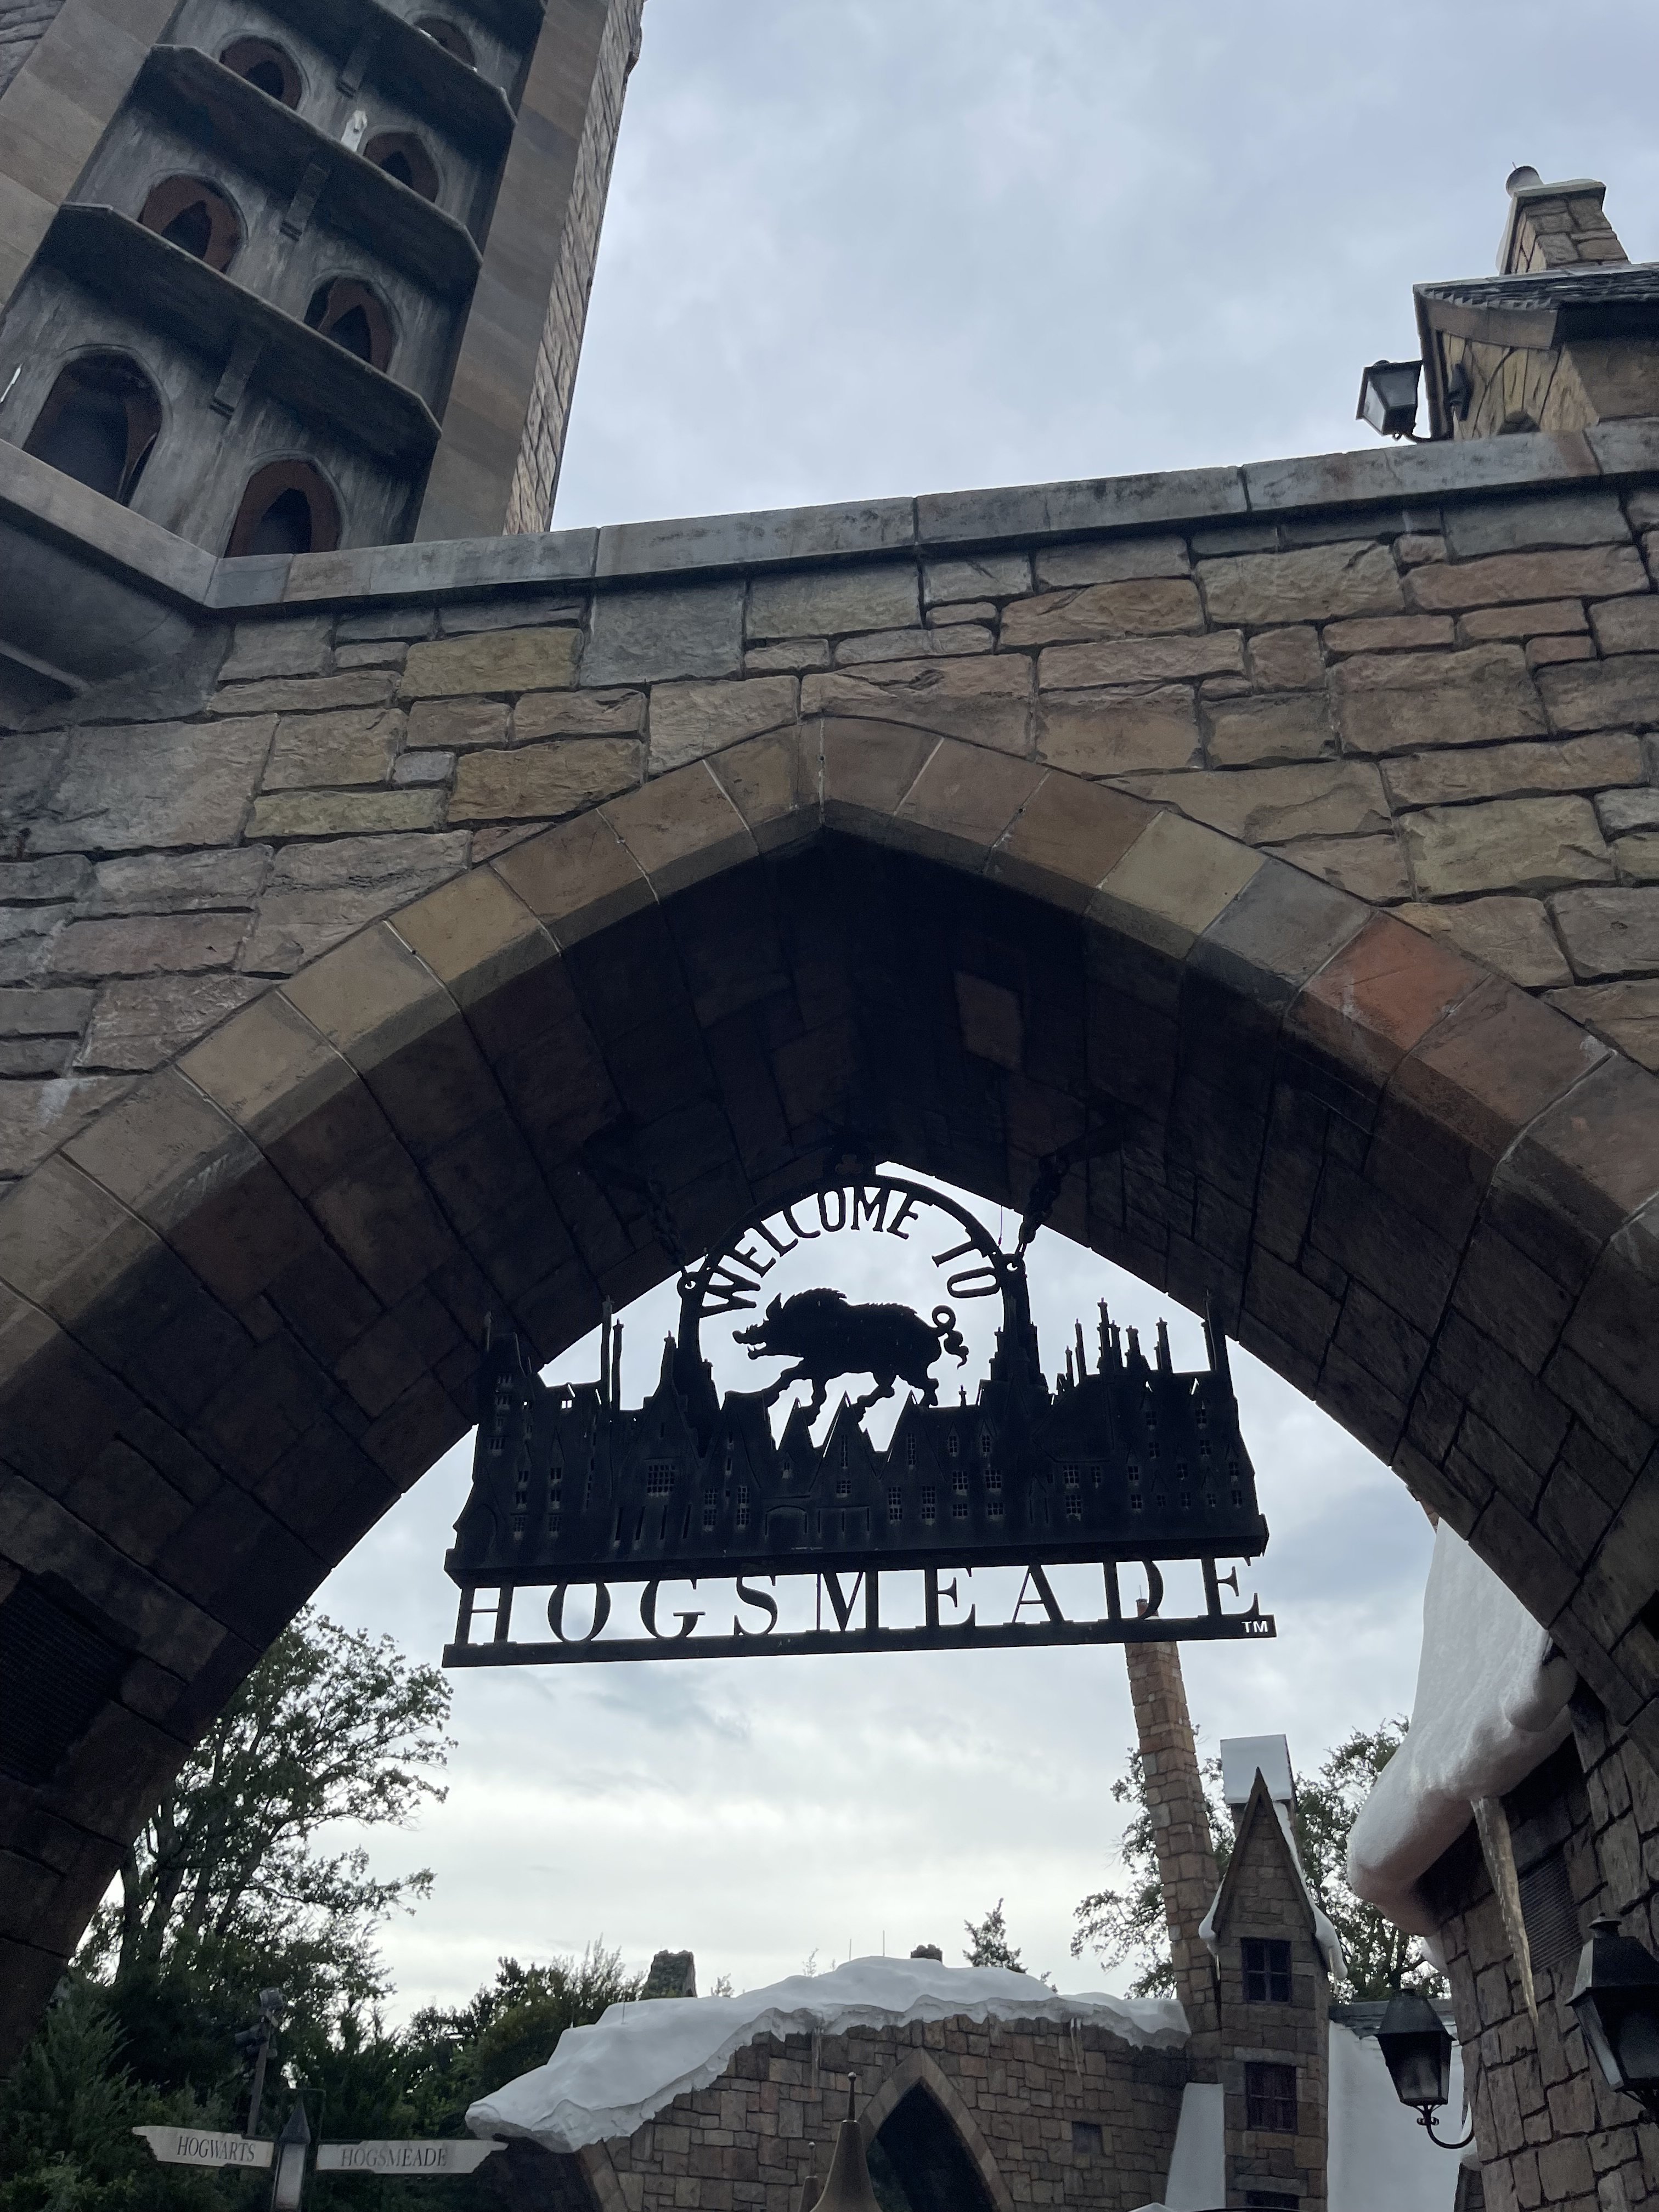
Entering Hogsmeade after Jurassic Park River Adventure
-
Here this evening with my son
-
What is the longest that you have physically waited in a line for a ride before? Time waiting for a virtual queue does not count.
-
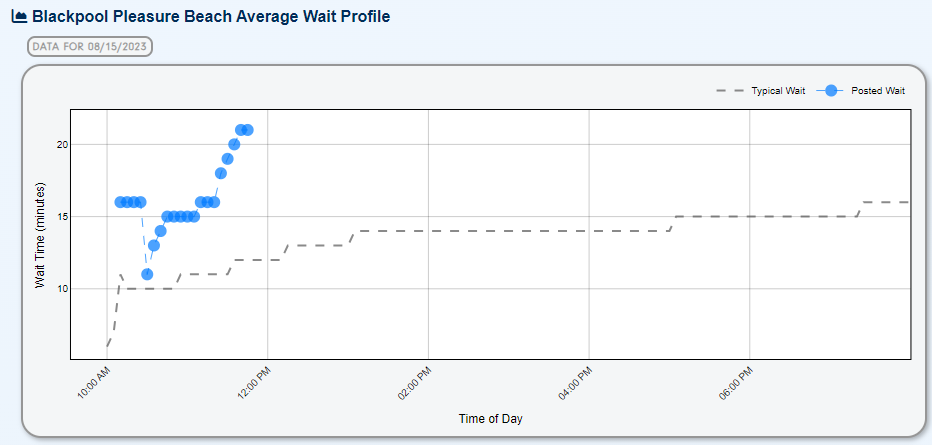
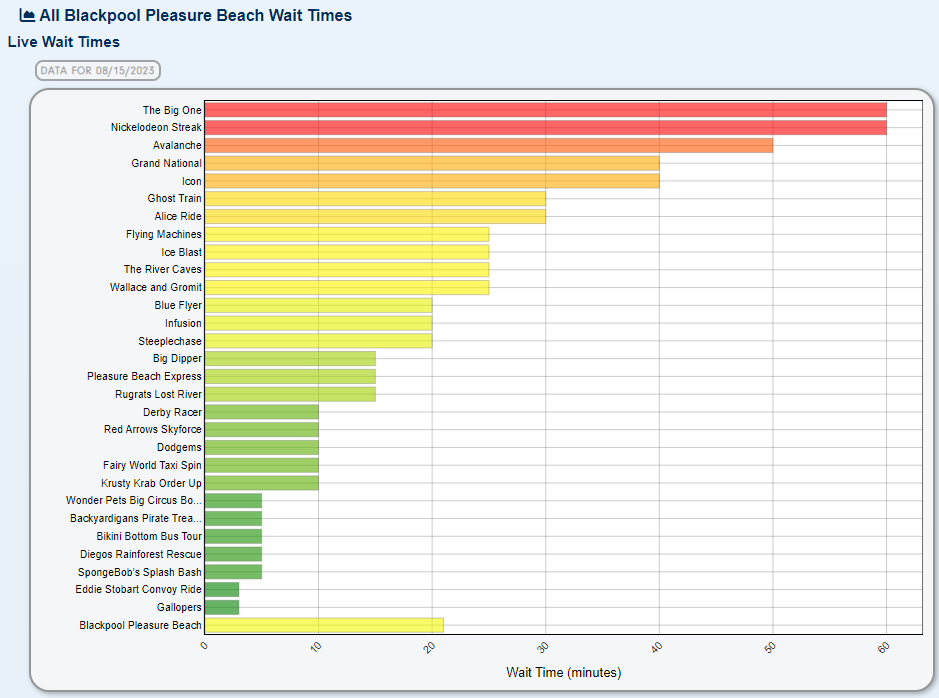
Here are some posted versus actual wait times at Blackpool Pleasure Beach today Flying Machines Posted Wait: 15 minutes User Reported Wait: 15 minutes Derby Racer Posted Wait: 15 minutes User Reported Wait: 16 minutes Blue Flyer Posted Wait: 10 minutes User Reported Wait: 4 minutes Diegos Rainforest Rescue Posted Wait: 10 minutes User Reported Wait: 4 minutes Avalanche Posted Wait: 25 minutes User Reported Wait: 49 minutes The River Caves Posted Wait: 15 minutes User Reported Wait: 16 minutes Ghost Train Posted Wait: 15 minutes User Reported Wait: 29 minutes Fairy World Taxi Spin Posted Wait: 10 minutes User Reported Wait: 22 minutes Bikini Bottom Bus Tour Posted Wait: 7 minutes User Reported Wait: 0 minutes Doras World Voyage Posted Wait: 10 minutes User Reported Wait: 1 minutes Blue Flyer Posted Wait: 10 minutes User Reported Wait: 5 minutes
-
How has the first half of August in 2023 compared to previous years at each Walt Disney World theme park? Let's take a look at the data so far to find out! Disney's Hollywood Studios At DHS, wait times are down over 7% compared to last year, but are up nearly 10% compared to the same period in 2019. At this point in 2019, Star Wars Galaxy's Edge was not yet open. Rise of the Resistance and Rock 'n' Roller Coaster are averaging a lower wait time this August than last year despite Slinky Dog Dash being up. 2019: 9.6% 2022: -7.8% EPCOT At EPCOT, wait times are very close to the same period last year, only down 0.2%. Wait times are up nearly 6% compared to before the pandemic. 2019: 5.6% 2022: -0.2% Disney's Animal Kingdom The biggest difference to past years is at Animal Kingdom. Wait times are down over 18% compared to last year and 36% compared to before the pandemic! Lower wait times for Avatar Flight of Passage and Kilimanjaro Safaris are a big reason for the differences. 2019: -36% 2022: -18% The Magic Kingdom Magic Kingdom wait times have also been way down to start August compared to last year and 2019. A big difference this year to last is the number of attractions operating. Several high profile rides are averaging higher wait times this August, including Seven Dwarfs Mine Train, Peter Pan's Flight, Space Mountain, and Thunder Mountain. Overall, you have more options, but some of the bigger attractions you will wait longer for. Pick Mickey's Not So Scary Halloween Party days to experience lower crowds too. 2019: -25% 2022: -14.6%
-

A Look Back at Past Halloween Horror Nights Events
Webmaster commented on Webmaster's blog entry in Data Bytes
You're welcome! -
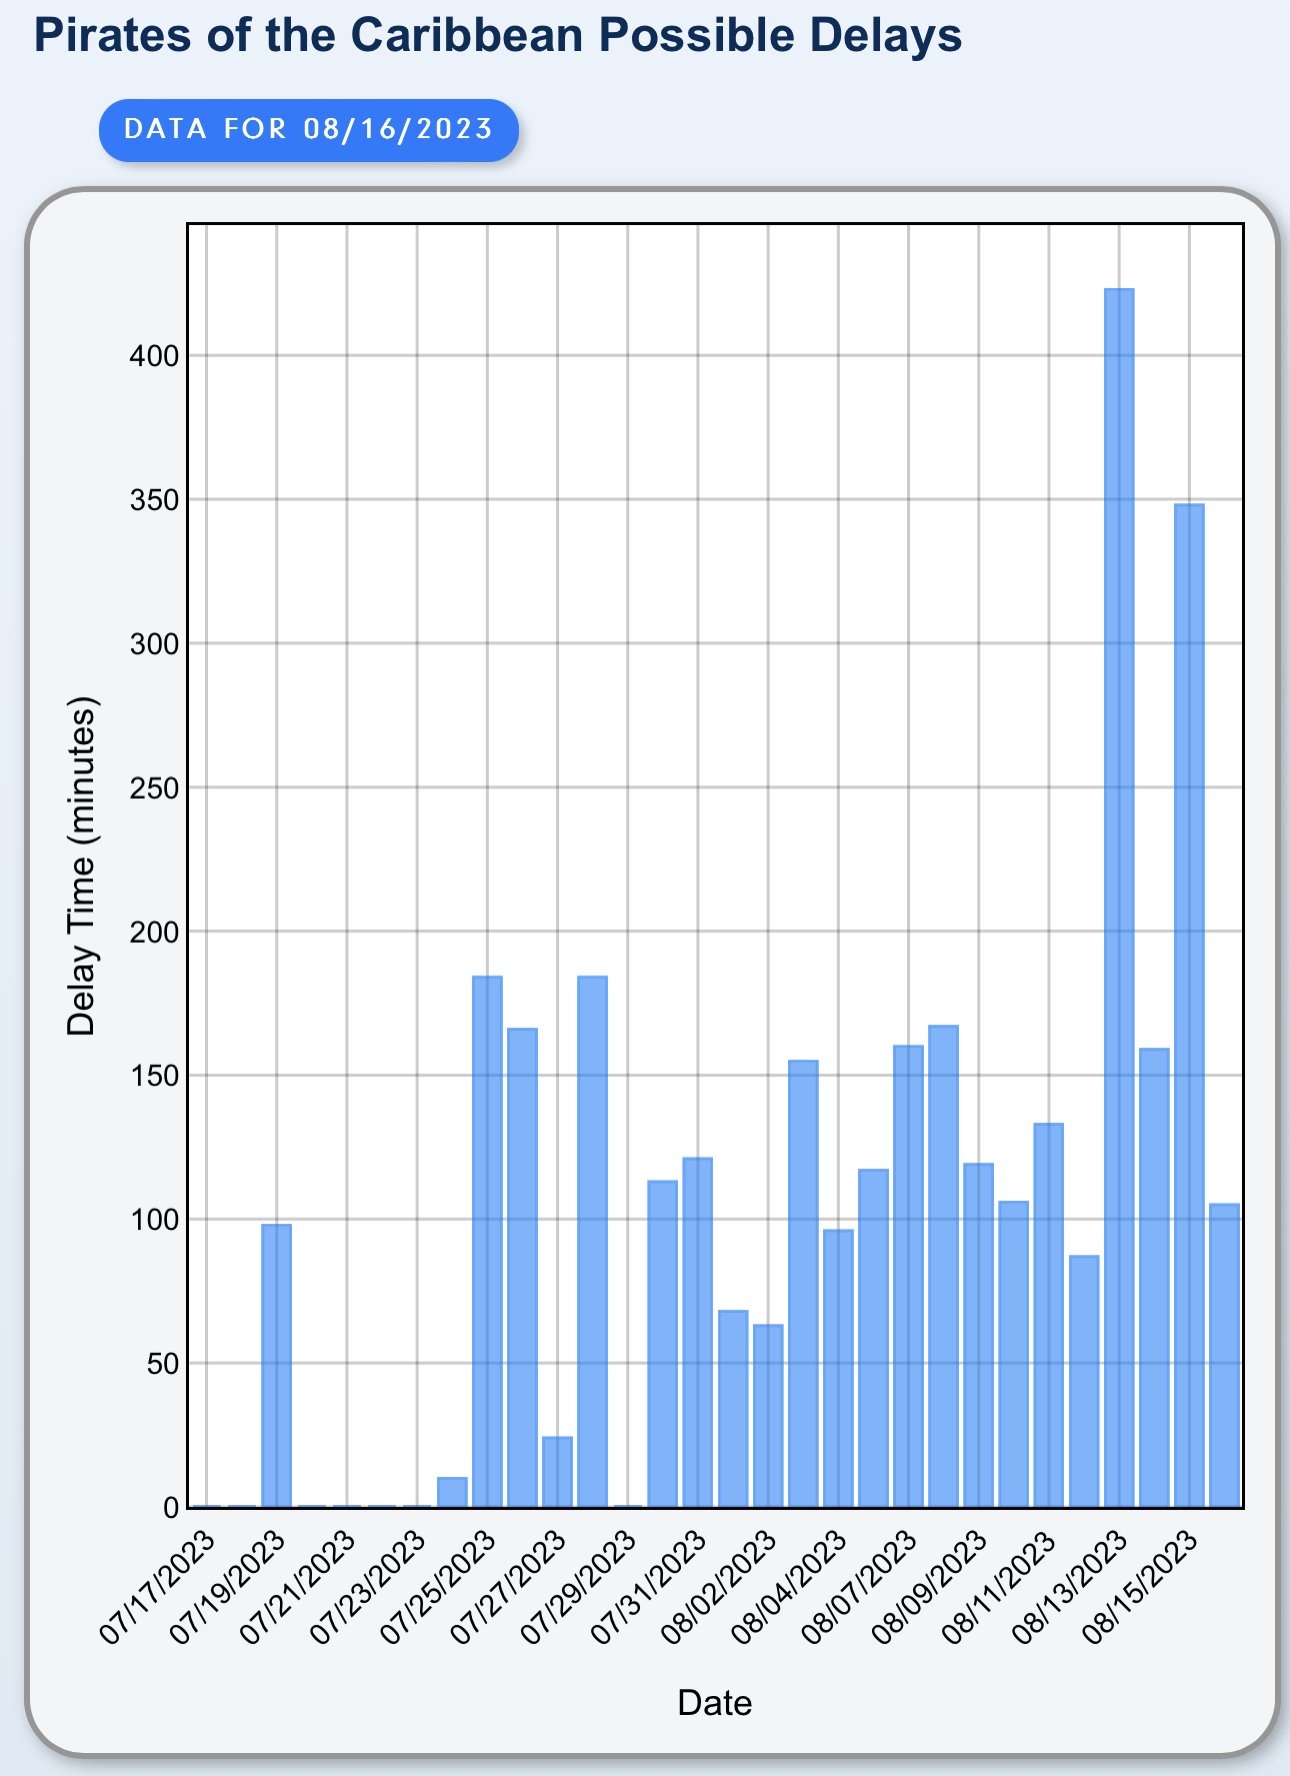
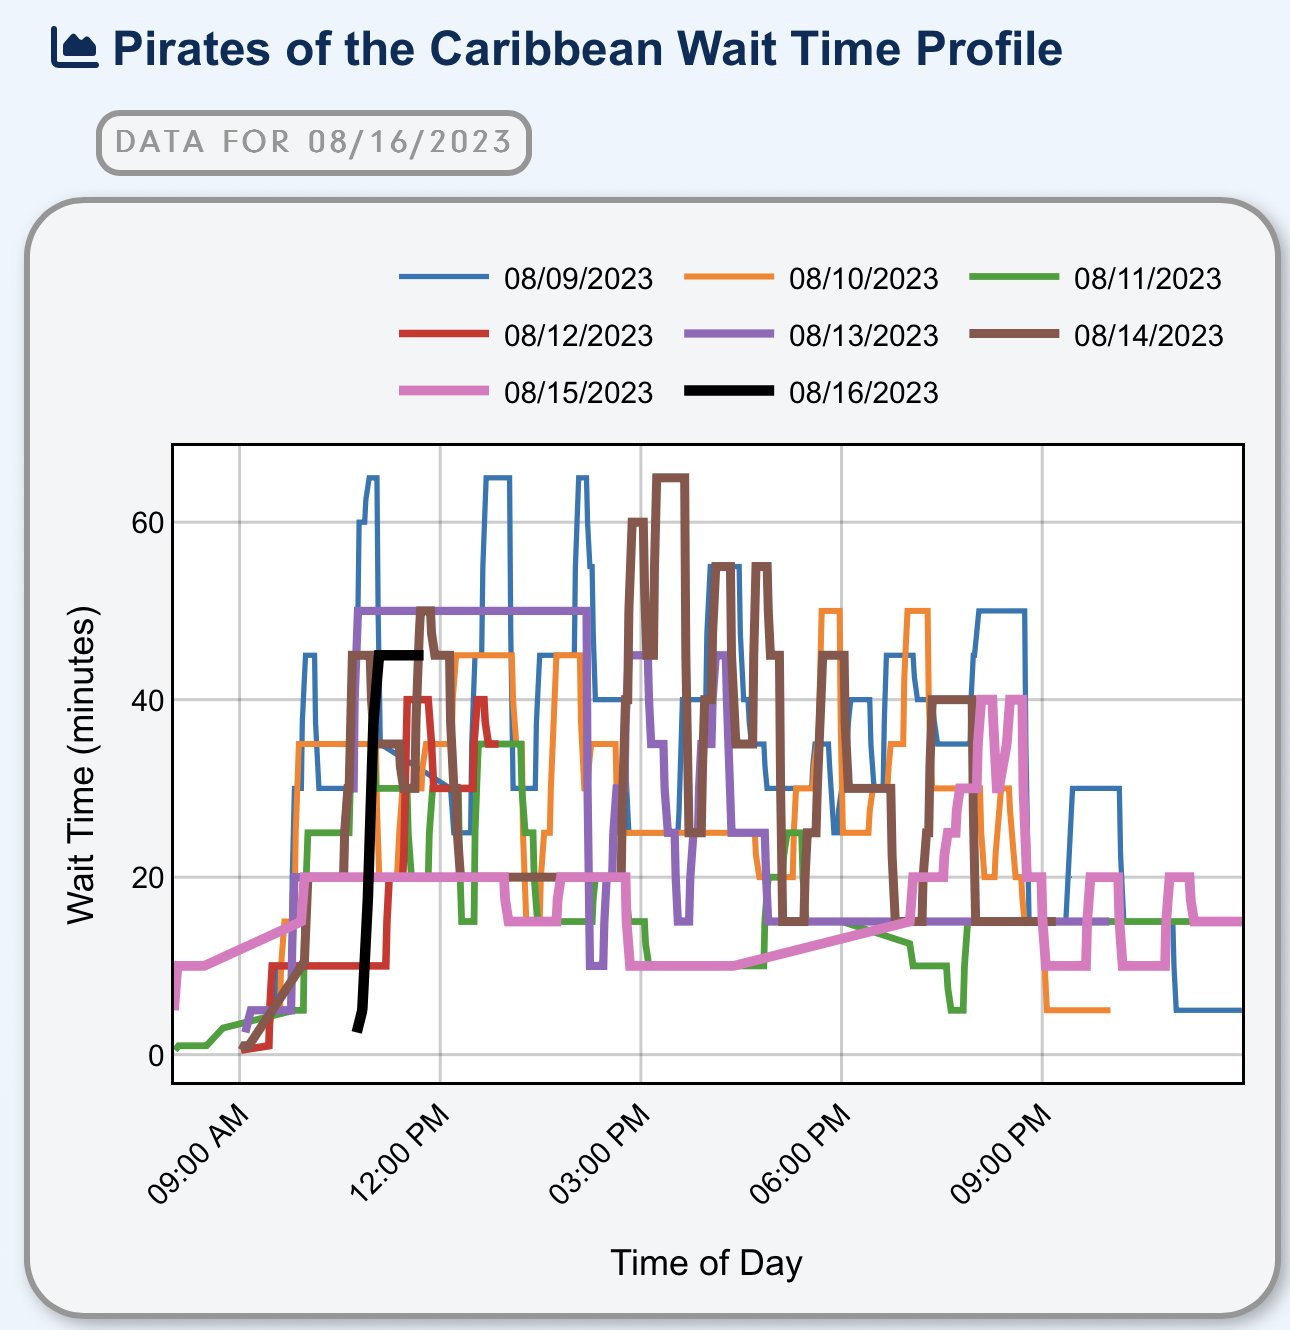
Pirates of the Caribbean at Disney World has been struggling to stay open due a rumored bay issue. This has led to some peaks in wait times
-
The 32nd edition of Halloween Horror Nights at Universal Orlando is soon upon us. This year's offering for HHN 32 includes: Stranger Things 4 The Last of Us The Exorcist: Believer Chucky: Ultimate Kill Count Universal Monsters: Unmasked Dr. Oddfellow’s Twisted Origi… Dueling Dragons: Choose Thy F… YETI: Campground Kills The Darkest Deal Blood Moon: Dark Offerings We can take a look at past house wait time data to get an idea of what might be the most popular houses and best days to attend HHN 23 later this year. Past House Wait Time Averages Each of the past full Horror Nights events (2019, 2021, and 2022), one house has clearly been the most popular choice with the highest wait time. 2019: Stranger Things 2021: Beetlejuice 2022: Halloween Notice that these are all major brand houses (and typically the second and third most popular were too). Expect the trend to continue this year with the return of the enormously popular Stranger Things and Last of US IPs, plus the Exorcist and Chucky. These houses will likely average 75+ minute wait times each night. Back in 2017, the Stranger Things house saw some absolutely massive wait times, as shown in the graph below. Most of the other houses built-up their waits slowly, allowing early arrivers to take advantage of more houses. Typically, the original houses have lower wait times too. It will be interesting to how popular the Dueling Dragons house is with its nostalgia factor. Past HHN Best/Worst Days to Go Trends on which day is best and worst to attend has varied over the past 3 events. In 2019, Tuesdays were clearly the worst day to visit, but the other days were pretty similar. In 2021, Wednesdays had the highest average waits, and Fridays were surprisingly lower. Last year, Monday took the crown for highest wait times while Tuesday and Friday were more mild. One tip is to is to avoid the Premier UOAP days, which are September 6th to 10th, 13th to 17th , 20th to 24th, 27th to 28th, and October 4th and 5th this year. While it seems counterintuitive, past data suggests Fridays may be a good day to go because the general perception is that it will be packed. HHN 31 Recap At the most recent HHN event from last year, HHN 31, the highest wait times were observed on Wednesday, October 19th. The lowest wait times were right after Hurricane Ian when crowds where intentionally limited. The sweet spot last year was the second weekend of the event. Events were heavy from mid October and on. October 11th was quite the anomaly. During the busiest event on 10/19/22, these were the house wait times by time of day. Expect Stranger Things 4 and The Last of Us to follow patterns similar to Halloween last year. If you want to do a higher quantity of houses, it is best to start with everything else between 6 and 7 PM. Questions? More tips? Ask them in the comments below!
-
Wait times lately for Slinky Dog Dash, a launched roller coaster at Disney's Hollywood Studios, have been high, averaging around a 90 minute wait time (or more) in recent weeks. Naturally, most park visitors do not prefer to wait that long in a queue. This leads to high demand for the coaster's Genie+ slots. Over the past month, Lightning Lane slots for Slinky Dog Dash have filled up in less than three minutes three times. It has sold out a total of six times before Hollywood Studios opened for the day too. If you are trying to visit Hollywood Studios with Genie+ and want to ride Slinky Dog Dash, make it your #1 priority at 7:00 AM! What if you were unable to secure a slot at first Lightning Lane release? Availability does sometimes randomly appear throughout the day. In the graph below, any non-gray blocks are times when Lightning Lane slots were available over the past month. It can sometimes pay off to keep refreshing the My Disney Experience app. If your only option is to wait in the queue, there are periodically some sweet spots between 12:00 PM and 3:00 PM. Just watch out for those afternoon thunderstorms. Right after the attraction comes back from a delay is a good time to ride too.
-
Star Wars: Rise of the Resistance has consistently been one of the most popular attractions at Walt Disney World since opening in December of 2019. Since leaving the boarding group system, and with the introduction of Lightning Lane in late 2021, the attraction can be accessed via the standby queue or with an Individual Lightning Lane (ILL). The latter option will cost each rider a varying amount of money to bypass most of the standby line. Amounts for the Individual Lightning Lane have varied from $15 to $25 per person. However, since March of this year, the price has not dropped below $20 per person. This is the same price as the newer TRON Lightcycle / Run roller coaster, which has been $20 each day since opening, and the 2022 addition Guardians of the Galaxy: Cosmic Rewind, which has never gone above $17 per person. Both of those aforementioned attractions are still on the Virtual Queue system. The Individual Lightning Lane price for Rise of the Resistance over time: Since ditching the Virtual Queue system in September 2021, the average wait time for Rise of the Resistance is 114 minutes (nearly 2 hours). The attraction has posted some massive wait times before, including 420 minutes last year. Though, if the wait times from that whole span are analyzed, a general downward trend in the wait times is observed. Note that most of the large spikes in wait times are caused by significant ride downtime in a given day, leading to longer standby times. If just this year is analyzed, outside of the holiday and Spring Break periods, the average wait time drops down to the 70 to 80 minute range for the majority of days. This year, the average wait time for Seven Dwarfs Mine Train is 89 minutes and the average for Avatar Flight of Passage is 100 minutes. The peak ILL price for these attractions? $12 and $16, respectively (with lower prices too). Individual Lightning Lane availability for Rise has also been very good over the summer. Rarely does it sell out prior to the park opening when everyone can purchase it. The graph below shows the sell out times for the past month. It doesn't seem to make too much sense for Rise of the Resistance to still be commanding its premium price. Overall, the data suggests that the Individual Lightning Lane for Star Wars: Rise of the Resistance is currently overpriced at its price floor of $20 per person. Our advice if you are on a budget? Save the money and use it elsewhere right now (i.e. to buy Genie+ to get on the rest of the park's attractions). A Genie+ slot for Slinky Dog Dash is more valuable as it is averaging 98 minute average wait time and it closes during bad weather. When is the best time to ride Rise of the Resistance? The standby line, with the wait times from the past month shown below, often has several periods in the day where the wait time drops below an hour. Evenings are also particularly light, beginning around 7:30 to 8:00 PM. What are your thoughts on Rise of the Resistance and its Individual Lightning Lane price? Share in the comments.
-
Wait times today so far at Blackpool Pleasure Beach are well above average https://www.thrill-data.com/waits/park/additional-parks-europe/blackpool-pleasure-beach/
-
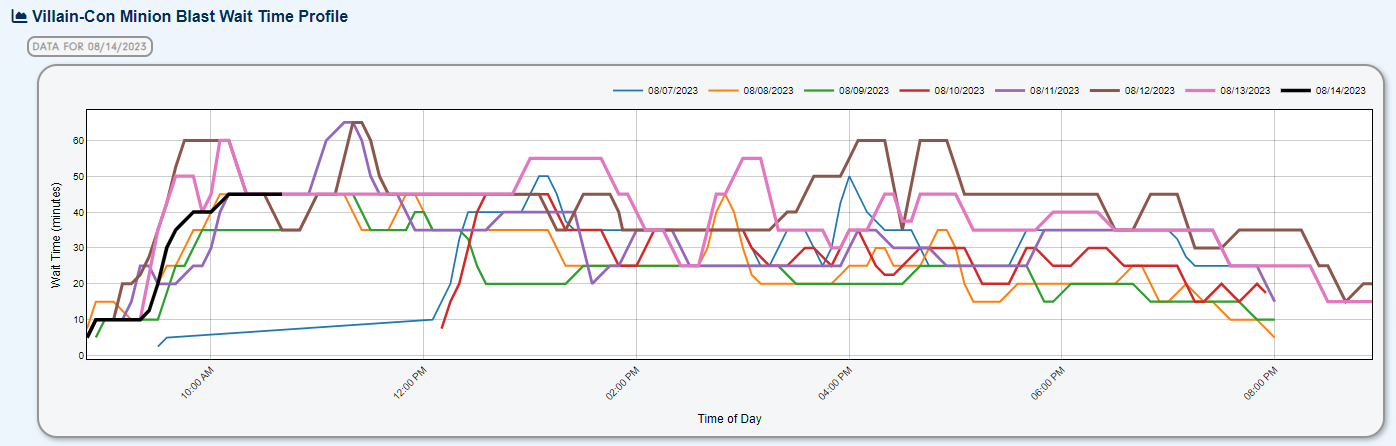
Villain-Con: Minion Blast officially opened at Universal Studios Florida last week. Wait times for the new attraction were higher this past weekend with the attraction accepting Universal Express (it did not during the technical rehearsals). The peak wait time posted was 65 minutes, with several other instances where it briefly hit an hour.
-
Depending on where a theme park is located, how popular a water ride is varies on a week to week basis. For most parks, peak water ride season is July and August, and wait times typically spike when there is a heat wave. In particular, a heat wave has been grappling Central Florida over the past week. Lets take a look at how wait times have varied for several water rides across North America since the beginning of July and see if there are any trends. Intuition says wait times should have been very high for Florida water rides over the past week, but was that actually true? Disney's Animal Kingdom is home to Kali River Rapids. Wait times for the attraction peaked at the end of July, but have remained high during the early August heat wave. At Islands of Adventure, home to three premier water rides, wait times have been mostly consistent. Popeye and Jurassic Park trended down last week. Dudley Do-Right's Ripsaw Falls has been consistently holding an average wait time of an hour or more for several weeks. At SeaWorld Orlando, Infinity Falls is typically a popular attraction if the weather is at all warm. Wait times peaked in early and mid-July. Last week's wait time were up slightly over the previous week too. At Busch Gardens Tampa, Congo River Rapids wait times have declined from a peak in early to mid July. At Disney California Adventure, wait times for Grizzly River Run have remained high this summer. Last week was a bit off of the peak seen in July, but still averaged a 45 minute wait time. White Water Canyon at Kings Island has seen a rapid rise in its wait time since the beginning of July, with much higher wait times the past four weeks. At Worlds of Fun, Fury of the Nile has averaged at least 40 minute wait time the past four weeks. Roaring Rapids at Six Flags Magic Mountain is averaging close to an hour wait the past several weeks as summer continues on. Meanwhile, Roaring Rapids at Six Flags Great America saw its highest wait times of the summer last week. The Smoky Mountain River Rampage has been popular most of the summer at Dollywood, but saw a significant drop in its average wait time last week. Wait times for Thunder Canyon at Dorney Park have been on the rise the past week weeks of summer, averaging over a half hour wait in recent weeks. Thunder Canyon at Valleyfair has seen a big increase in popularity the past 3 weeks. The peak was 50 minutes two weeks ago. Wait times for Thunder River at Six Flags St Louis peaked at the end of July, but have been mild since. Finally, wait times continue to rise for White Water Canyon at Kings Dominion as summer continues on. In general, wait times at parks located in more northern states seem to be on the rise in recent weeks. Wait times at the Florida theme parks plateaued in July and are on the way down; however, they are not short , but rather less than seen in the peak of summer. The current extreme heat and school starting has led to a decrease in overall wait times at the Florida parks, impacting the water rides too. Do you like getting wet, or even soaked, at water rides to help stay cool?
-
Posted vs. Actual Waits at Six Flags Great America
Webmaster posted a topic in Wait Time Discussions
Here are some comparisons of posted versus actual wait times from this weekend at Six Flags Great America. Generally, wait times were less than what was posted. Superman Ultimate Flight Posted Wait: 40 minutes User Reported Wait: 22 minutes THE FLASH: Vertical Velocity Posted Wait: 30 minutes User Reported Wait: 66 minutes Batman The Ride Posted Wait: 45 minutes User Reported Wait: 28 minutes X Flight Posted Wait: 45 minutes User Reported Wait: 21 minutes Raging Bull Posted Wait: 45 minutes User Reported Wait: 26 minutes Goliath Posted Wait: 50 minutes User Reported Wait: 22 minutes- 1 reply
-
- 1
-

-
This week (8/7 to 8/13/2023), wait times across Walt Disney World were down 3 minutes compared to last week, with an average wait time of 33 minutes (last week was down 4 minutes compared to the previous week, for reference). Out of the past 84 weeks, this week would rank #72. The same week last year ranks #43 with an average wait time of 39 minutes. Also, kudos to those who braved the extreme heat this week. It was brutal out there even for Florida! Local Orange County schools (and many other Florida counties) began on Thursday, leading to less local influence on Thursday and Friday last week. Genie+ prices did not drop below $25 per person for the Magic Kingdom/Park Hopper option. Past weeks had dropped to $23 per person on the weekend. At Disney's Animal Kingdom, the hardest Lightning Lane slot this past week was Expedition Everest Avatar Flight of Passage had the highest average wait time at 85 minutes. At EPCOT, the fastest selling out Lightning Lane was for Test Track. Test Track also had the highest average wait time at 77 minutes. The 1 PM boarding group drop for Guardians of the Galaxy: Cosmic Rewind was easy most days the past week. You could Park Hop and get it all but 2 days. At Disney's Hollywood Studios, the fastest selling out Lightning Lane attraction was Slinky Dog Dash, which sold out before the park opening plus 2 hour mark, on average. Slinky Dog Dash also had the highest average wait time at 93 minutes. At the Magic Kingdom, outside of the parade, meeting Ariel was the fastest selling out Lightning Lane. Seven Dwarfs Mine Train led the way with a 80 minute average wait time. The 1 PM boarding group drop for TRON Lightcycle / Run was obtainable at 1 PM, but only lasted to the Park Hop time at 2 PM twice. At the park, the separately ticketed event, Mickey's Not So Scary Halloween Party, commonly called MNSSHP, also began Friday. TRON was still using a Virtual Queue for the event, and boarding groups lasted mere seconds at 6 PM. With controlled crowds and no Genie+, lines are still shorter than the regular day. Follow wait times for each event at https://www.thrill-data.com/mnsshp/2023 Looking forward to the next few weeks, wait times typically drop with different areas beginning school. View the Crowd Calendar any time at https://www.thrill-data.com/trip-planning/crowd-calendar/resort/wdw
-
Downloads should have the past 2 years, if there was data collected then. Which park is not giving further data back?
-
Over the past several weekends, the maximum price for Genie+ had dropped down to $23 per person on the weekends. However, that did not happen this week as it remained at $25 per person. You can see the prices any time at https://www.thrill-data.com/news/disney-world-genie-plus-price-tracker/
-
Disney World Early August Wait Time Comparisons
Webmaster commented on Webmaster's blog entry in Data Bytes
You're welcome!